Just over half the New Zealand population (51 percent) is female. Males outnumber females among children and youth, but females predominate among adults, particularly from the late twenties to the mid-forties, and from the late fifties onwards. More males are born than females, but male youth have higher mortality rates than females. The imbalance in the middle years is an outcome of sex differences in net migration (there were more males than females in the net migration loss in the three years before the 2001 Census, and more females than males in the net migration gain of the previous five years). At older ages it reflects the higher mortality rates of males.
Figure P3 Population by age and sex,
2002
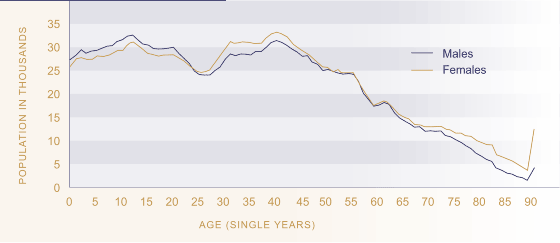
Source: Statistics New Zealand
The New Zealand population is ageing: the median age of the population was 35 years in 2001, and is expected to rise to 38 years by 2011, and to 40 years by 2021.6
The proportion of the population under 15 years of age has declined from 26 percent in 1982 to 22 percent in 2002 and is expected to fall to 19 percent by 2012. The population aged 65 and over has increased from 10 percent of the total population in 1982 to 12 percent in 2002. This figure is projected to reach 14 percent by 2012, assuming medium fertility, medium mortality, and long-term an annual net migration gain of 5,000.
Population ageing within the working age group will be partly offset over the next decade by the entry of the ‘baby blip’ - the relatively large generation of babies born around 1990 - into the young adult age groups. By 2012, the 15-24 age group is expected to be 16 percent larger than it was in 2002. Over the same period, there will be a slight decline in the number of people aged 25-44, and an increase of 26 percent in the population aged 45-64 years. By 2012, 45–64-year-olds will make up 39 percent of the working age population, compared with 34 percent in 2002.
Age structure varies by ethnic group. In 2001, the European ethnic group population was the oldest, with a median age of 37 years, followed by Asians (28 years), other ethnic groups (26 years), Māori (22 years) and Pacific peoples (21 years). By 2021, half of all Māori will be older than 27 years, and half of all Pacific peoples older than 24 years. Over the same period, the median age of European and Asian New Zealanders is expected to have risen to 44 years and 36 years, respectively.7