| Introduction | | People | | Health | | Knowledge & Skills | | Paid Work | | Economic Standard of Living | | Civil & Political Rights |
| Cultural Identity | | Leisure & Recreation | | Safety | | Social Connectedness | | Life Satisfaction | | Summary | | Notes & References |
DownloadCivil & Political Rights - PDF, 224kb |
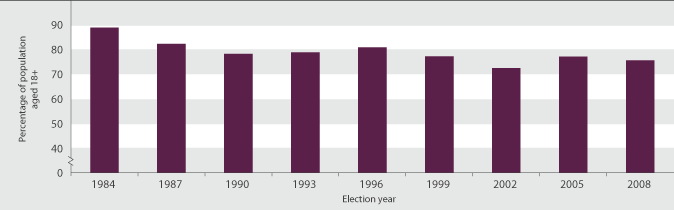
Voter turnoutDefinitionGeneral elections: The proportion of the estimated voting-age population (aged 18 years and over) who cast a vote in general elections. Local authority elections: The proportion of all enrolled electors (both resident and ratepayer) who cast a vote in contested local authority elections. RelevanceVoter turnout rates are an indicator of the confidence the population has in political institutions, the importance they attach to them, and the extent to which they feel their participation can make a difference. 1. General electionsCurrent level and trendsVoter turnout of the eligible population in 2008 was 76 percent, a slight decline from 77 percent in 2005. Voter participation in general elections sharply from 89 percent in 1984 to 78 percent in 1990, increased slightly to 81 percent in 1996, then fell again to a new low of 72.5 percent in 2002. Figure CP1.1 Proportion of estimated voting-age population who cast votes, 1984–2008
Sources: Electoral Commission (2002); Electoral Commission (2005); Electoral Commission (2008) Age, sex, ethnic and socio-economic differencesIn the New Zealand General Social Survey conducted between April 2008 and March 2009, 80 percent of respondents said they had voted in the last general election. People aged 65 years and over had the highest reported turnout (94 percent), followed by people aged 45–64 years (89 percent) and those aged 25–44 years (77 percent). Fewer than half of 15–24 year olds (46 percent) said they had voted, but many were not eligible to do so on age and other grounds. Significant differences in voter turnout were found between the unemployed (68 percent) and the employed (79 percent); between Asian people (61 percent) and people in the mainly European group (82 percent); and between people with personal incomes of $30,000 or less (75 percent) and people with incomes of $70,001 or more (89 percent). There were no significant differences by sex or region. International comparisonUsing a different definition of voter turnout (the proportion of the registered population who voted), New Zealand ranked 10th out of 30 OECD countries with a voter turnout rate of 79 percent in 2008.81 This was higher than the OECD median of 72 percent for recent elections. Voter turnout in New Zealand was lower than that of Australia, where voting is compulsory (95 percent in 2007), but higher than Canada (59 percent in 2008), the United Kingdom (65 percent in 2010) and the United States (62 percent in 2008). 2. Local authority electionsCurrent level and trendsVoter turnout in the 2007 local authority elections was 44 percent, down from 46 percent in 2004.82 This was the lowest turnout since the restructuring of local government in 1989. Voter turnout peaked at 61 percent in 1992 and has declined steadily since then, except between 1995 and 1998 when it increased from 53 percent to 55 percent. The drop in turnout between 2004 and 2007 was relatively constant across all types of local authorities, with falls of two or three percentage points. In 2007, there were 249 elected local authorities in New Zealand: 12 regional councils, 21 district health boards, 16 city councils, 57 district councils and 143 community boards. Table CP1.1 Voter turnout (%) in local authority elections, 1989–2007
Sources: Department of Internal Affairs (2006) Table 3.3; Department of Internal Affairs (2009) Table 4.3 The 2007 election results continued the pattern of previous local authority elections, with smaller and South Island communities tending to register a higher voter turnout across all election types. The highest voter turnout in regional council elections was for the West Coast Regional Council (57 percent), followed by Taranaki (52 percent). Turnout was lower than the regional council average of 43 percent in Waikato (37 percent) and Auckland (38 percent). Local authority voter turnout is highest for district councils, especially those in the South Island. In the 2007 district council elections, voter turnout in the South Island was 53 percent, compared with 47 percent in the North Island. Smaller local authorities and small district health boards also attracted a higher turnout than larger local authorities. Voter turnout ranged from 54 percent for small district councils to 39 percent for large city councils. |
||||||||||||||||||||||||||||||||||||||||||||||||||||||||||||||||||||||||