| Introduction | | People | | Health | | Knowledge & Skills | | Paid Work | | Economic Standard of Living | | Civil & Political Rights |
| Cultural Identity | | Leisure & Recreation | | Safety | | Social Connectedness | | Life Satisfaction | | Summary | | Notes & References |
DownloadSafety - PDF, 305kb |
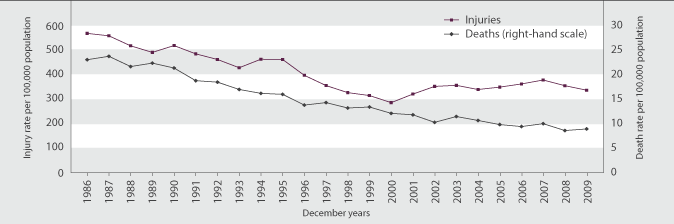
Road casualtiesDefinitionThe number of people killed or injured in motor vehicle crashes as a proportion (per 100,000) of the total population. RelevanceMotor vehicle crashes are a major cause of premature death, especially among younger age groups. Deaths, injuries and disability resulting from motor vehicle crashes inflict considerable pain and suffering on individuals, families and communities, as well as on other road users, emergency service providers, health workers and others. Current level and trendsIn 2009, 384 people died as a result of motor vehicle crashes, a rate of 8.9 deaths per 100,000 population. Provisional reported injury data for 2009 shows a further 14,540 people were injured, a rate of 337 injuries per 100,000 population. In 2008, the road user death rate was 8.6 per 100,000 and the road user injury rate was 356 per 100,000.100 Deaths and injuries from motor vehicle crashes have declined substantially since 1986, when the rates were 23.1 and 570 per 100,000 population, respectively. The number of people killed in motor vehicle crashes was 50 percent lower in 2009 than it was in 1986. Although the number of people injured has risen since 2000 (partly because of better recording by police), there were 23 percent fewer people injured in 2009 than in 1986. There is no conclusive evidence on the reasons for the reduction in road casualties since 1986. Better roads and better vehicles, as well as legislation, enforcement and education aimed at reducing road casualties, may all have contributed to an improvement in drivers’ attitudes and behaviour. Figure SS4.1 Road user injury and death rates, 1986–2009
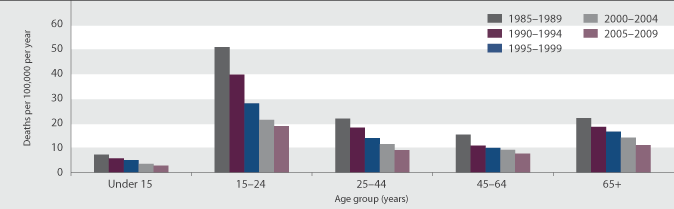
Source: Ministry of Transport Age and sex differencesYoung people aged 15–24 years are at a far higher risk of death from motor vehicle crashes than any other age group. Death rates for 15–24 year olds in the period 2005–2009 were double those of the population as a whole. The risk of dying in a crash is relatively low in middle age, then increases at older ages, partly because the very old are more fragile. The road user death rate has fallen steadily for all age groups since the mid-1980s. The decline has been particularly marked among 15–24 year olds, who had an average annual rate of 19 deaths per 100,000 in the period 2005–2009, a big improvement on the average annual rate of 51 deaths per 100,000 in the 1985–1989 period and 28 deaths per 100,000 in the period 1995–1999. Males are much more likely than females to be killed in motor vehicle crashes. Between 2005 and 2009, the average annual road user death rate for males was 13 deaths per 100,000 males, while the rate for females was 6 deaths per 100,000 females. For both sexes, this was less than half the average annual rate in the mid-1980s (33 deaths per 100,000 for males and 14 per 100,000 for females in 1985–1989), and around two-thirds the average annual rate in the mid-1990s (19 per 100,000 for males and 9 per 100,000 for females in 1995–1999). Figure SS4.2 Five-year average annual road user death rate, by age group, 1985–1989 to 2005–2009
Source: Ministry of Transport, rates derived by the Ministry of Social Development Ethnic differencesMāori are significantly more likely than non-Māori to die as the result of a motor vehicle accident. In 2007, the provisional age-standardised road accident death rate was 22 per 100,000 population for Māori and 9 per 100,000 for non-Māori. Table SS4.1 Land transport accident death rate, by ethnicity, 2000–2007
Source: Ministry of Health International comparisonNew Zealand was ranked 16th out of 27 OECD countries with data for the years 2005–2008, with a road user death rate of 8.6 per 100,000 people in 2008. This was higher than the OECD median of 7.8 deaths per 100,000. Iceland had the lowest road user death rate (3.8 per 100,000 in 2008), while Greece had the highest (14.4 per 100,000 in 2007). The New Zealand road user death rate was lower than those of the United States (12.3 per 100,000 in 2008) and Canada (9.2 per 100,000 in 2006), but higher than those of Ireland (7.8 per 100,000 in 2007), Australia (6.8 per 100,000 in 2008) and the United Kingdom (4.3 per 100,000 in 2008).101 Among the 24 OECD countries with road user death rates by age, New Zealand (with Greece and Poland) had the highest death rate for children under 15 years. At 2.6 deaths per 100,000, it was double the OECD median of 1.3. New Zealand also had the highest rate for 15–17 year olds, with 15.0 deaths per 100,000, more than double the OECD median of 7.3. For people aged 65 years and over, New Zealand’s rate of 9.3 deaths per 100,000 was just below the OECD median of 10.6. » View technical details about the road casualties indicator |
|||||||||||||||||||||||||||||||||||||||