Civil and political rights
Acceptance of diversity
Definition
The proportion of the population aged 15 years and over who reported that they would feel “very comfortable” or “comfortable” if they had a new neighbour who was a member of a selected range of minority groups.
RelevanceTop
Diverse societies enrich many aspects of life but this advantage can be hindered through intolerance and the marginalisation of some groups and individuals. The inability of people to be accepted can impact on access to education, healthcare and employment, and successful participation in their community.
Current level and trendsTop
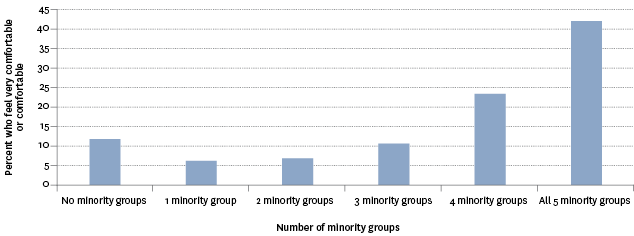
A further 23.6 percent said they would feel very comfortable or comfortable with four out of the five minority groups of new neighbours; 10.4 said three out of the five groups; 6.2 percent said two out of the five groups; 5.8 percent said one out of the five groups; and 11.8 percent said that they would not feel comfortable with any of the five minority groups.
Figure CP5.1 – Level of comfort (very comfortable/comfortable) with having new
neighbours from five selected minority groups, 2014
Source: Statistics New Zealand, New Zealand General Social Survey
When looking at the specific minority groups, people were equally very comfortable or comfortable with new neighbours who were new migrants (76.4 percent), from a religious minority (76.0 percent), GLBT (75.1 percent) or from a racial or ethnic minority (74.8 percent). People were less likely to say that they would feel comfortable or very comfortable with a new neighbour who had a mental illness (51.7 percent).
Table CP5.1 – Level of comfort towards a new neighbour from a
selected minority group, 2014
| Level of comfort | From a religious minority | Gay, lesbian, bisexual or transgender | Racial or ethnic minority | Mental illness | New migrant |
|---|---|---|---|---|---|
| Very comfortable | 28.9 | 32.0 | 30.0 | 15.5 | 28.5 |
| Comfortable | 47.1 | 43.1 | 44.8 | 36.2 | 47.9 |
| Neither comfortable nor uncomfortable | 20.5 | 18.3 | 18.2 | 27.6 | 20.0 |
| Uncomfortable | 2.9 | 5.0 | 5.9 | 18.0 | 3.1 |
| Very uncomfortable | 0.5 | 1.6 | 1.1 | 2.7 | 0.4 |
| Very comfortable/ comfortable |
76.0 | 75.1 | 74.8 | 51.7 | 76.4 |
Source: Statistics New Zealand, New Zealand General Social Survey
Age and sex differencesTop
In 2014, younger people were more likely than older adults to say that they would feel very comfortable or comfortable with new neighbours from any of the selected minority groups. Nearly half (49.4 percent) of those aged 15–24 years said they would feel very comfortable or comfortable with all five groups, compared with 36.2 percent of those aged 65–74 years and 34.0 percent of those aged 75 years and over. The figures for those aged 25–64 years were between 40.1 percent and 44.7 percent.
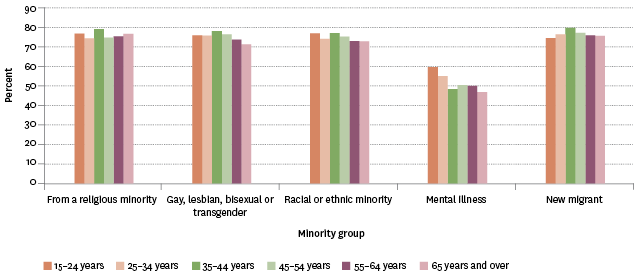
Younger people (59.6 percent of those aged 15–24 years and 55.0 percent of those aged 25–34 years) were more likely than older age groups (between 45.5 percent and 50.3 percent of those aged 35 years and over) to say they would feel very comfortable or comfortable with a new neighbour who had a mental illness.
A similar proportion of males (43.0 percent) and females (41.3 percent) reported that they would feel very comfortable or comfortable with all five groups of new neighbours. Females (77.3 percent) were more likely than males (72.7 percent) to report that they would feel very comfortable or comfortable if they had a new neighbour who was GLBT. There were no other differences between the sexes across the other minority groups.
Figure CP5.2 – Proportion of population who said they would feel very comfortable
or comfortable with a new neighbour from a selected minority group, by age group, 2014
Source: Statistics New Zealand, New Zealand General Social Survey
Ethnic differencesTop
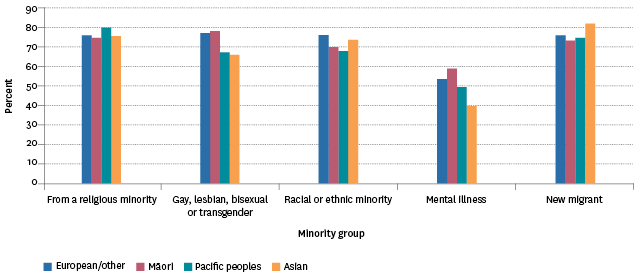
In 2014, Māori (45.7 percent) and those in the European/Other group (44.2 percent) were more likely than Pacific peoples (37.8 percent) and those in the Asian ethnic group (32.4 percent) to report that they would feel very comfortable or comfortable with all five groups of new neighbours.
Those in the European/Other group (77.1 percent) and Māori (77.9 percent) were more likely than other ethnic groups to say they would feel very comfortable or comfortable if they had a new neighbour who was GLBT. Those in the European/Other (76.3 percent) and Asian (73.6 percent) ethnic groups were more likely than other ethnic groups to say they would feel very comfortable or comfortable if they had a new neighbour who was from a racial or ethnic minority. The Asian ethnic group were the most likely of all ethnic groups to say they would feel very comfortable or comfortable if they had a new neighbour who was a new migrant (81.6 percent compared with 75.9 percent of European/Others, 74.7 percent of Pacific peoples and 73.3 percent of Māori).
Māori (59.2 percent) were more likely than other ethnic groups to say they would feel very comfortable or comfortable if they had a new neighbour who had a mental illness.
Figure CP5.3 – Proportion of population who said they would feel very comfortable
or comfortable with a new neighbour from a selected minority group,
by ethnic group, 2014
Source: Statistics New Zealand, New Zealand General Social Survey
Socio-economic differencesTop
In 2014, people with personal incomes of over $70,000 were more likely than those on lower incomes to say that they would feel very comfortable or comfortable if they had a new neighbour who was from a religious minority (79.4 percent), was GLBT (79.9 percent), was from a racial or ethnic minority (80.0 percent), or was a new migrant (81.4 percent). Proportions of those who felt very comfortable or comfortable with a new neighbour who had a mental illness were similar across the three income groups (51.9 percent of those earning over $70,000, compared with 51.0 percent of those earning between $30,001 and $70,000, and 52.2 percent of those earning less than $30,001).
When looking at material wellbeing, a similar pattern emerged; those who were in the higher and upper middle material wellbeing index categories were more likely than those in the lower middle and lower categories to say they would feel very comfortable or comfortable if they had a new neighbour from a religious minority (78.9 percent of people in the higher category and 76.1 percent of people in the upper middle category), who was GLBT (79.4 percent and 73.8 percent respectively), who was from a racial or ethnic minority (79.4 percent and 74.6 percent respectively) or who was a new migrant (80.7 percent and 75.6 percent respectively). Those in the higher material wellbeing category were more likely than the other categories to say they would feel very comfortable or comfortable with a new neighbour who had a mental illness (56.8 percent compared with around 49 percent for the other categories).
Labour force status differencesTop
In 2014, people who were employed, unemployed or not in the labour force had similar levels of comfort towards new neighbours from selected minority groups. For example, 76.4 percent of employed people reported that they would feel very comfortable or comfortable with a new neighbour who was from a religious minority, while the proportions for those unemployed or not in the labour force were 74.2 percent and 75.4 percent respectively.
Family type differencesTop
People living without children (either in couple family types or those not living in a family nucleus) were slightly more likely than people living with children to say they would feel very comfortable or comfortable if they had a new neighbour from a religious minority (77.4 percent of couples without children and 77.9 percent of people not in a family nucleus), who was GLBT (76.4 percent and 77.2 percent respectively), who was from a racial or ethnic minority (75.7 percent and 75.8 percent respectively), or who was a new migrant (77.3 percent and 77.1 percent respectively). All family types had similar levels of comfort towards a new neighbour who had a mental illness (between 50.5 percent and 52.8 percent said they would feel very comfortable or comfortable).
Migrant status differencesTop
Migrants who arrived in New Zealand within the last five years (81.5 percent) were more likely than those who were born in New Zealand (75.2 percent) or who were longer-term migrants (77.4 percent) to say they would feel very comfortable or comfortable if they had a new neighbour from a religious minority. They were also more likely to say they would feel very comfortable or comfortable with a new neighbour who was also a new migrant (85.6 percent, compared with 74.1 percent of New Zealand-born people and 81.7 percent of long-term migrants). People born in New Zealand were more likely than those not born in New Zealand to say they would feel very comfortable or comfortable if they had a new neighbour who was GLBT (76.8 percent compared with 70.1 percent of long-term migrants and 74.1 percent of recent migrants).
Regional differencesTop
In 2014, Tasman/Nelson/Marlborough/West Coast had the highest proportion of people reporting that they would feel very comfortable or comfortable with a new neighbour who was GLBT or from a racial or ethnic minority (both 79.6 percent). Manawatu-Wanganui had the lowest proportion of people reporting that they would feel comfortable with a new neighbour who was from a religious minority (68.5 percent), who was from a racial or ethnic minority (65.0 percent) or who was a new migrant (66.3 percent). Southland had the highest proportion of people reporting that they would feel very comfortable or comfortable with a new neighbour who had a mental illness (62.7 percent) or was a new migrant (82.2 percent).
Data for this section can be found at: www.socialreport.msd.govt.nz/documents/2016/cp5.xlsx
