Economic standard of living
Household crowding
Definition
The proportion of the population living in crowded housing (ie requiring one or more additional bedrooms, as defined by the Canadian Crowding Index).
RelevanceTop
Current level and trendsTop
In 2013, 269,172 people (7 percent) lived in households needing one additional bedroom, while 129,123 people (3 percent) lived in households needing two or more additional bedrooms.
The proportion with one or more spare bedrooms has increased. This has resulted more from a decline in the proportion of those with no spare bedrooms, than a change in the proportion of those needing one or more additional rooms.
Figure EC6.1 – Proportion of population by bedroom requirements, 1986–2013
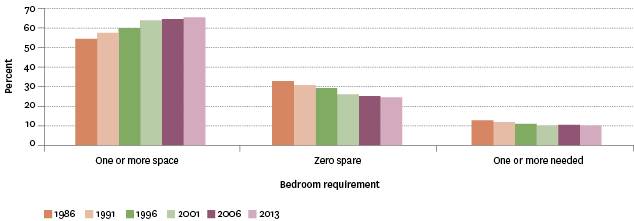
Source: Statistics New Zealand
Age and sex differencesTop
Living in crowded households is more likely to be experienced by younger people and declines with age, likely reflecting life cycle and family formation patterns. In 2013, 130,995 (16 percent) of those aged 0–14 years and 93,198 (18 percent) of those aged 15–24 years lived in crowded households. For those 75 years and over, 4,128 people (2 percent) lived in crowded households.
Table EC6.1 – Proportion and number of people needing one or more additional
bedrooms, by age group, 2013
| 0–14 | 15–24 | 25–44 | 45–54 | 55–64 | 65–74 | 75+ | Total | |
|---|---|---|---|---|---|---|---|---|
| Number | 130,995 | 93,198 | 103,641 | 38,223 | 19,359 | 8,745 | 4,128 | 398,295 |
| Percent | 16 | 18 | 10 | 7 | 4 | 3 | 2 | 10 |
Source: Statistics New Zealand
There is very little difference between the sexes in the likelihood of living in crowded households.
Ethnic differencesTop
Māori, Pacific peoples and Europeans/Other all showed a decrease from 1986 in the proportion living in crowded households. Those in the Asian and MELAA ethnic groups have seen a decrease over the more recent census periods.
Figure EC6.2 – Proportion of people needing one or more additional bedrooms,
by ethnic group, 1986–2013
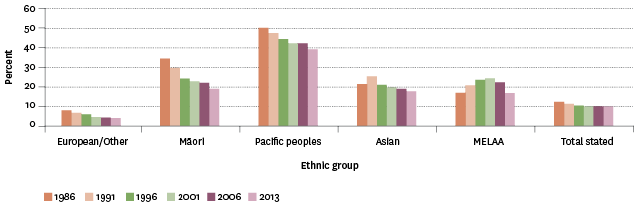
Source: Statistics New Zealand
Household differencesTop
In 2013, multi-family households with dependent children had the highest proportion of people living in crowded households (118,539 people, or 50 percent of multi-family households), followed by one-parent families with dependent children (78,330 people, or 21 percent). Couples with dependent children had the largest number, but a lower proportion, of people in crowded households (138,978 people, or 10 percent of couples with dependent children).
Over the last three census periods from 2001, multi-family households with dependent children have shown the most significant drop in the proportion living in crowded households (56 percent down to 50 percent). The remaining household types experienced minor changes over this period.
Tenure and income differencesTop
There is also a difference in the decline in household crowding over time when looking at household tenure. Over the period 1986–2013, where households were owned or were partly owned the percentage of those in crowded households fell by 4.4 percentage points, compared with a smaller drop of 2.6 percentage points for those in households not owned.
Figure EC6.3 – Proportion needing one or more bedrooms, by household tenure,
1986–2013
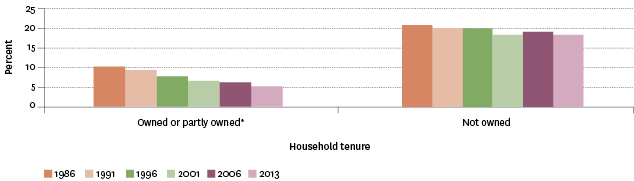
Source: Statistics New Zealand
Note: * “Dwelling was held in a family trust” was not asked before 2006 but, for this figure, has been added to dwellings owned or partly owned for 2006 and 2013.
Regional differencesTop
In 2013, Auckland had the highest proportion of people living in crowded households (203,820 people, or 16 percent), followed by Gisborne (5,913 people, or 15 percent) and Northland (13,853 people, or 10 percent). This line-up has remained relatively stable since 1986.
Otago had the lowest proportion of people in crowded households (7,659 people, or 4.1 percent), followed by the West Coast (1,047 people, or 3.7 percent).
Between 1986 and 2013, the percentage point drop in household crowding in all regions was greater than the national drop (3 percentage points), with the exception of Auckland, where the percentage point drop was 1 percent. Given Auckland's large population, the poorer Auckland result has had an impact on the overall New Zealand result.
International comparisonTop
Data for this section can be found at: www.socialreport.msd.govt.nz/documents/2016/ec6.xlsx
