Economic standard of living
Housing affordability
Definition
The proportion of households and the proportion of people within households spending more than 30 percent of their disposable income on housing.
RelevanceTop
Affordable housing is important for people’s wellbeing. For lower-income households especially, high housing costs relative to income are often associated with severe financial difficulty, and can leave households with insufficient income to meet other basic needs such as food, clothing, transport, medical care and education. High outgoings-to-income ratios (OTI) are not as critical for higher-income households, as there is still sufficient income left for their basic needs.
Current level and trendsTop
In 2014, 27 percent of New Zealand households spent more than 30 percent of their disposable income on housing costs. This is a little lower than the high point in 2011 (28 percent), but higher than the level in the first half of the 2000s (21–22 percent).
Since the late 1980s, there has been a substantial increase in the proportion of households spending more than 30 percent of their income on housing. Between 1988 and 1998, the proportion rose from 11 percent to 24 percent of households, before falling to 21 percent in 2004 then again rising.
In 2014, 15 percent of New Zealand households spent more than 40 percent of their disposable income on housing costs, and 8 percent spent more than 50 percent.
Figure EC5.1 – Proportion of households with housing cost outgoings-to-income ratio
greater than 30 percent, 1988–2014
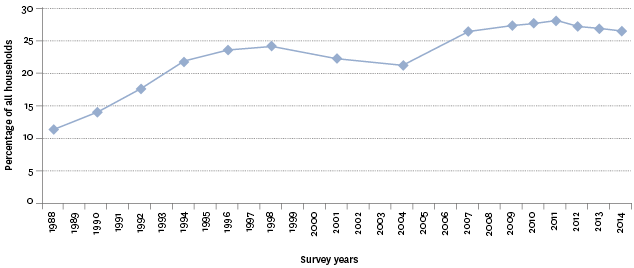
Source: Perry (2015a), Ministry of Social Development, using data from Statistics New Zealand's Household Economic Survey
Note: The period between Household Economic Surveys has varied across the period shown.
Age and sex differencesTop
In 2014, 34 percent of children aged under 18 years lived in households that spent more than 30 percent of their disposable income on housing costs. This was the same level as in 2013, but an increase on the 2004 level (26 percent) and significantly higher than the 1988 level (12 percent). Those aged 65 years and over had the lowest proportion living in households that spent more than 30 percent of their disposable income on housing costs (11 percent in 2014).
In 2014, females were slightly more likely than males aged 15 years and over to be living in households that spent more than 30 percent of their disposable income on housing costs (26 and 24 percent respectively). This ranking has largely remained consistent over the period of the survey.
Table EC5.1 – Proportion of individuals in households with housing cost
outgoings-to-income ratio greater than 30 percent, by age group, 1988–2014
| Survey year | 0–17 | 18–24 | 25–44 | 45–64 | 65+ | Male aged 15+ | Female aged 15+ | Total |
|---|---|---|---|---|---|---|---|---|
| 1988 | 12 | 12 | 15 | 5 | 3 | 10 | 10 | 11 |
| 1990 | 16 | 16 | 18 | 7 | 2 | 12 | 13 | 14 |
| 1992 | 22 | 21 | 24 | 8 | 3 | 16 | 16 | 18 |
| 1994 | 27 | 22 | 28 | 10 | 5 | 17 | 20 | 22 |
| 1996 | 32 | 24 | 28 | 14 | 6 | 19 | 22 | 24 |
| 1998 | 33 | 26 | 31 | 14 | 7 | 21 | 23 | 26 |
| 2001 | 32 | 29 | 28 | 16 | 7 | 20 | 22 | 25 |
| 2004 | 26 | 28 | 25 | 15 | 6 | 20 | 19 | 22 |
| 2007 | 32 | 33 | 33 | 20 | 9 | 23 | 26 | 27 |
| 2009 | 39 | 26 | 35 | 22 | 8 | 25 | 26 | 29 |
| 2010 | 35 | 31 | 34 | 22 | 10 | 24 | 26 | 28 |
| 2011 | 33 | 35 | 34 | 23 | 8 | 25 | 26 | 28 |
| 2012 | 37 | 32 | 35 | 20 | 10 | 25 | 26 | 28 |
| 2013 | 34 | 28 | 35 | 20 | 9 | 24 | 25 | 27 |
| 2014 | 34 | 35 | 32 | 21 | 11 | 24 | 26 | 27 |
Source: Perry (2015a), Ministry of Social Development, using data from Statistics New Zealand's Household Economic Survey
Note: The period between Household Economic Surveys has varied across the period shown.
Ethnic differencesTop
Because of small sample numbers, results by ethnicity have been averaged over the period 2011–2014, precluding reporting detailed time series results. For those who lived in households that spent more than 30 percent of their disposable income on housing costs averaged for the survey periods 2011–2014, the proportion for the Other ethnic group was 40 percent, for Pacific peoples 34 percent, for Māori 30 percent and for Europeans 23 percent. This ranking has persisted over the period of the survey.
Socio-economic differencesTop
In 2014, 41 percent of those in the lowest household income quintile spent more than 30 percent of their disposable income on housing costs, compared with 10 percent for those in the top income quintile.
Over time, changes in results for the lowest income quintile have been more strongly influenced by economic conditions and impacted by the introduction of policies such as income related rents for Housing New Zealand Corporation clients in 2000. The trend for the lowest income quintile was a steep rise to 1994 (48 percent), then a decline to 2004 (34 percent), and a subsequent rise to 41–43 percent over the 2011 to 2014 period. For the highest income quintile, the changes have been less pronounced, with lows of 9 percent in 1988, 2012 and 2013 and a high of 17 percent in 2009. In the late 1980s to early 1990s, the ratio of the rate for the lowest income quintile relative to the highest income quintile was 2, and has since increased to 5 for the most recent period.
Figure EC5.2 – Proportion of households with housing cost outgoings-to-income ratio
greater than 30 percent, by income quintile (Q1-Q5), 1988–2014
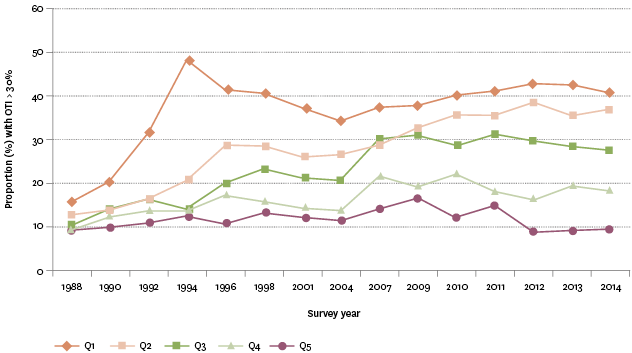
Source: Perry (2015a), Ministry of Social Development, using data from Statistics New Zealand's Household Economic Survey
Note: The period between Household Economic Surveys has varied across the period shown.
Household type differencesTop
Data for this section can be found at: www.socialreport.msd.govt.nz/documents/2016/ec5.xlsx
