Economic standard of living
Material hardship
Definition
The proportion of the population in households with Material Wellbeing Index (MWI) scores below two thresholds.
RelevanceTop
Two thresholds, representing more severe and less severe hardship, are used.
Current level and trendsTop
In 2014, 8.0 percent of people lived in households identified as experiencing material hardship, based on the MWI less severe threshold and using data from the Household Economic Survey (HES). This was slightly lower than the result for 2013 (9.2 percent).
In 2014, 4.5 percent of people lived in households facing more severe material hardship, compared with 5.0 percent in 2013.
Figure EC4.1 – Proportion of population with material hardship, 2007–2014
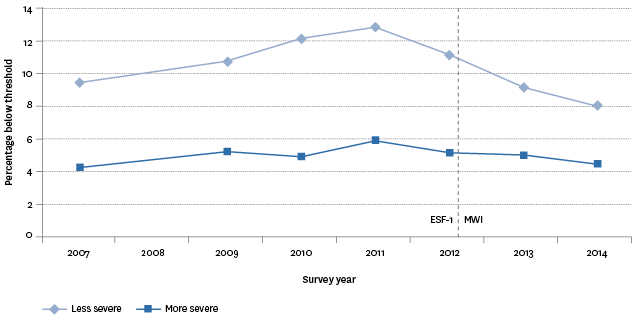
Source: Perry (2015a), Ministry of Social Development, using data from Statistics New Zealand's Household Economic Survey
Notes: The period between Household Economic Surveys has varied across the period shown. Results for 2007 to 2012 use the Economic Living Standard Index Short Form (ESF-1) modified to match the Material Wellbeing Index (MWI) used in 2013 and 2014.
Age differencesTop
There are clear differences in material hardship when looking at age. Using the less severe threshold averaged over 2013 and 2014, the age group with the highest proportion living in households facing material hardship was children aged 0–17 years of age (15 percent). The next highest group was those aged 18–24 years (10 percent), followed by 25–44 year olds (8 percent), 45–64 year olds (6 percent) and those aged 65 years and older (2 percent).
Figure EC4.2 – Proportion of population below the less severe material hardship
threshold, by age group, 2013–2014 averaged
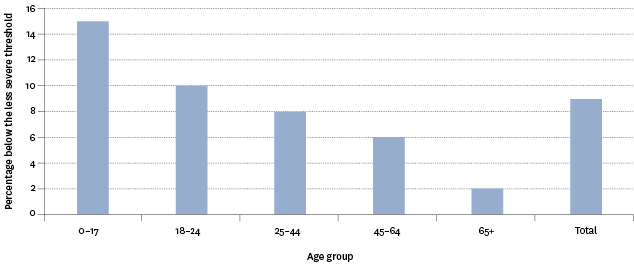
Source: Perry (2015a), Ministry of Social Development, using data from Statistics New Zealand's Household Economic Survey
Note: Results are averaged over the 2012/2013 and 2013/2014 survey periods.
Ethnic differencesTop
Using the less severe threshold averaged over 2013 and 2014, the proportion of people facing material hardship was highest for Pacific peoples (35 percent), followed by Māori (20 percent), Europeans (5 percent) and the Other ethnic group (4 percent).
Household type differencesTop
Sole-parent households with dependent children had the largest proportion of people facing material hardship, using the less severe threshold averaged over 2013 and 2014 (31 percent). This compared with 2 percent for households with people aged 65 years and older and 3 percent for couple-only households aged under 65 years. The proportion of two-parent households with dependent children living under the less severe threshold was 8 percent.
International comparisonTop
Using a 13-item deprivation index developed by Eurostat and data from 2008 and 2009 and their “standard” threshold, New Zealand ranked well for older people aged 65 years and over (3 percent, compared with a median of 11 percent for 27 European countries). For the total New Zealand population, the rate was 11 percent, close to the European median of 13 percent. An 18 percent hardship rate for children aged 0–17 years of age was above the European median of 16 percent, and ranked New Zealand as doing less well than almost all the richer western European countries against whom New Zealand has traditionally benchmarked.
Data for this section can be found at: www.socialreport.msd.govt.nz/documents/2016/ec4.xlsx
