Health
Life expectancy at birth
Definition
The average length of life remaining at birth, assuming people experience the age-specific death rates of a given period from birth onwards.
RelevanceTop
Life expectancy at birth is a key summary indicator of fatal health outcomes (ie the survival experience of the population). Life expectancy at birth for the period 2012–2014 is based on death rates of that period, and takes no account of changes in death rates after that period.
Current levels and trendsTop
In 2012–2014, life expectancy at birth for females was 83.2 years and 79.5 years for males, as calculated by Statistics New Zealand Period Life Tables.
Since 2005–2007, life expectancy at birth has increased by 1.0 years for females and 1.5 years for males. About two–thirds of this increase was a result of reduced death rates at age 60 years and over.
The gap between male and female life expectancy has narrowed in recent decades, from the largest difference of 6.4 years in 1975–1977 to 3.7 years in 2012–2014. The narrowing is mainly because of faster reductions in male death rates at ages 50–74 years, although males still experience higher death rates than females at nearly all ages.
Figure H1.1 – Life expectancy at birth, by sex, 1950–1952 to 2012–2014
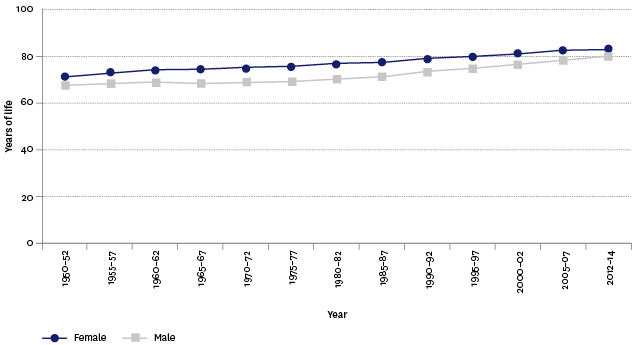
Source: Statistics New Zealand
Note: There is a seven-year gap between 2005–2007 and 2012–2014, which differs from the rest of the time series which has a five-year gap.
Ethnic differencesTop
There are marked differences in life expectancy at birth between ethnic groups. In 2012–2014, non-Māori female life expectancy at birth was 83.9 years and non-Māori males 80.3 years, both being higher than Māori females’ and Māori males’ life expectancy at birth of 77.1 years and 73.0 years respectively. This difference reflects that Māori death rates are higher than non-Māori at nearly all ages, and this has to do with a number of factors including smoking rates and socio-economic factors.
In 2012–2014, life expectancy at birth was 78.7 years for Pacific females and 74.5 years for Pacific males; 84.1 years for European/Other females and 80.5 percent for European/Other males; and 87.2 years for Asian females and 84.4 years for Asian males.
Between 2005–2007 and 2012–2014, Māori have had the highest increase in life expectancy at birth (2.6 years for Māori males and 2.0 years for Māori females). About 60 percent of the increase in Māori life expectancy at birth between 2005–2007 and 2012–2014 was owing to reduced death rates of people aged 55–84 years.
Pacific males and females had the same level of increase between 2005–2007 and 2012–2014 (1.3 years), which was largely driven by lower death rates of people aged 60–79 years. Non-Māori males had a similar increase in life expectancy to Pacific peoples (1.3 years), while non-Māori females had the lowest increase (0.9 years). People in the Asian ethnic group and European/Others had similar increases – males had an increase of 1.2 years between the two time periods, while females had a 0.8–0.9 year increase between 2005–2007 and 2012–2014.
Over time, life expectancy trends differ by ethnic group. For non-Māori from 1950–1952 to 2012–2014, there was a steady increase in life expectancy at birth with a 12-year increase for non-Māori males and an 11.5 year increase for non-Māori females over this time. Māori, on the other hand, experienced a continued improvement since the early 2000s.
The gap between Māori and non-Māori life expectancy at birth has narrowed to 7.1 years in 2012–2014, compared with 9.1 years in 1995–1997. This reduction is mainly because of lower death rates of people aged 50–79 years.
Figure H1.2 – Life expectancy at birth, by ethnic group and sex, 1950–1952 to 2012–2014
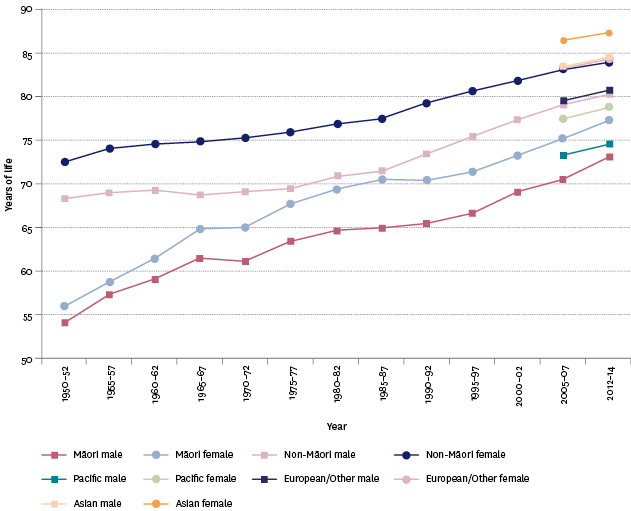
Source: Statistics New Zealand
Notes: Ministry of Health data has been used for 1980–1982 to 1995–1997. It includes an adjustment for the undercount of Māori deaths relative to the Māori population by linking mortality to census records. There is a seven-year gap between 2005–2007 and 2012–2014, which differs from the rest of the time series which has a five-year gap. Life expectancy breakdowns for Pacific, European/Other and Asian populations are available from 2005–2007.
Socio-economic differencesTop
Regional differencesTop
In 2012–2014, life expectancy at birth was highest for females in the Tasman region (84.1 years) and for males in the Auckland region (80.5 years). Life expectancy was the lowest for both sexes in the Gisborne region (80.4 years for females and 76.2 years for males). Hawke’s Bay had the highest increase in life expectancy between 2005–2007 and 2002–2014, with a 1.2 year increase for females and 1.5 year increase for males.
International comparisonTop
In 2012–2014, New Zealand males’ life expectancy at birth (79.5 years) was higher than the 2013 OECD median of 78.7 years for males. New Zealand females’ life expectancy at birth (83.2 years) was slightly lower than the 2013 OECD median of 83.7 years for females. In 2013, Japan had the highest life expectancy for females (86.6 years) and Switzerland for males (80.7 years) of the OECD countries, along with Spain (86.1 years for females) and Iceland (80.5 years for males). Mexico had the lowest life expectancy of the OECD countries for both sexes (77.4 years for females and 71.7 years for males).
Data for this section can be found at: www.socialreport.msd.govt.nz/documents/2016/h1.xlsx
