Health
Participation in physical activity
Definition
The proportion of the population aged 15 years and over who met physical activity guidelines.
RelevanceTop
Participation in physical activity has positive benefits for people's physical and mental health. Increased physical activity can lead to fewer health problems and higher productivity at work, especially when combined with a balanced diet and a healthy lifestyle. It can also contribute to personal growth and development, and is a source of social interaction (ie a good way to meet new people).
Current level and trendsTop
In 2013/2014, the age-standardised proportion of people meeting the physical activity guidelines (reporting they have been physically active for at least 30 minutes a day on five or more days in the past week) was 51.8 percent, as measured by the New Zealand Health Survey. This was similar to previous years (52.3 percent in 2012/2013 and 52.9 percent in 2006/2007), but lower than 2011/2012 (55.3 percent).
An estimated 1,839,000 New Zealanders aged 15 years and over met the physical activity guidelines in 2013/2014, which is similar to the estimated number in 2012/2013 (1,840,000).
Age and sex differencesTop
Males were more likely than females to meet the physical activity guidelines. In 2013/2014, 55.2 percent of males reported being physically active for at least 30 minutes a day for five or more days in the last week, compared with 48.5 percent of females.
These differences have been reflected over time – in 2006/2007, 56.5 percent of males reported meeting physical activity guidelines, compared with 49.5 percent of females.
Figure H9.1 – Proportion of population aged 15 years and over who met physical
activity guidelines in the last week, by sex, 2006/2007–2013/2014
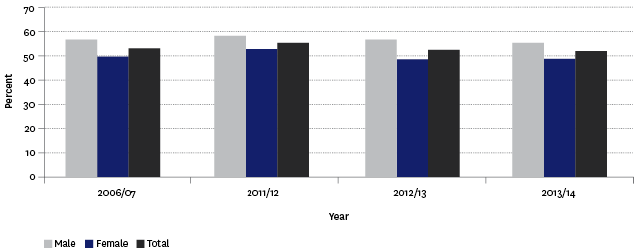
Source: Ministry of Health, New Zealand Health Survey
Note: Data has been age-standardised to the WHO World Standard population.
Similar levels of physical activity were reported for all age groups except those aged 75 years and above. Not surprisingly, those aged 75 years and over had the lowest proportion (42.5 percent) reporting levels of physical activity that met the guidelines. However, the proportion of those aged 75 and over meeting the physical activity guidelines has been increasing (from 34.5 percent in 2006/2007).
Table H9.1 – Proportion of population aged 15 years and over who met physical
activity guidelines in the last week, by age group and sex, 2006/2007–2013/2014
| 15–24 | 25–34 | 35–44 | 45–54 | 55–64 | 65–74 | 75+ | |
|---|---|---|---|---|---|---|---|
| 2006/07 | |||||||
| Male | 64.6 | 59.8 | 54.3 | 52.1 | 51.8 | 52.6 | 42.3 |
| Female | 48.2 | 50.1 | 51.5 | 52.8 | 52.5 | 46.9 | 29.1 |
| Total | 56.5 | 54.8 | 52.9 | 52.4 | 52.1 | 49.5 | 34.5 |
| 2011/12 | |||||||
| Male | 62.5 | 59.6 | 58.2 | 57.6 | 57.3 | 55.1 | 39 |
| Female | 52.4 | 52.8 | 54.9 | 54.4 | 56.9 | 47.2 | 29.3 |
| Total | 57.6 | 56.2 | 56.5 | 55.9 | 57.1 | 51 | 33.6 |
| 2012/13 | |||||||
| Male | 61.8 | 58.4 | 55.4 | 55.3 | 54.2 | 49.9 | 41.5 |
| Female | 47.3 | 47.1 | 48.6 | 53.3 | 51.6 | 45.6 | 35.9 |
| Total | 54.8 | 52.7 | 51.9 | 54.2 | 52.9 | 47.8 | 38.4 |
| 2013/14 | |||||||
| Male | 55.9 | 58.1 | 53.8 | 55.9 | 54.2 | 54.4 | 42.9 |
| Female | 45 | 48.7 | 51 | 49.9 | 51.2 | 48.2 | 42.2 |
| Total | 50.6 | 53.3 | 52.3 | 52.8 | 52.7 | 51.3 | 42.5 |
Source: Ministry of Health, New Zealand Health Survey
Note: Data has been age-standardised to the WHO World Standard population.
Ethnic differencesTop
In 2013/2014, people in the Asian ethnic group (40.6 percent) and Pacific peoples (44.2 percent) were less likely to meet physical activity guidelines, compared with people in the European/Other group (55.0 percent) and Māori (49.8 percent).
Māori proportions showed the biggest decline in activity levels, from 54.8 percent in 2006/2007 to 49.8 percent in 2013/2014. There were also large differences between males and females in the Māori and Pacific peoples groups, with a 12.0 percentage point difference between Māori males and Māori females, and a 13.4 percentage point difference between Pacific males and females. There were smaller differences between males and females for the other ethnic groups.
Figure H9.2 – Proportion of population aged 15 years and over who met physical activity
guidelines in the last week, by ethnic group, 2006/2007–2013/2014
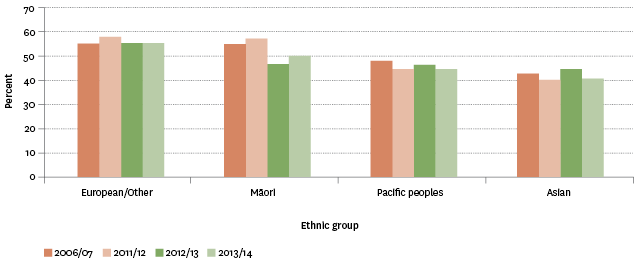
Source: Ministry of Health, New Zealand Health Survey
Note: Data has been age-standardised to the WHO World Standard population.
Socio-economic differencesTop
In 2013/2014, a greater proportion of people living in the least deprived areas were more likely than those living in the most deprived areas to meet physical activity guidelines (ie 51.8 percent for those living in NZDep2013 quintile level 1 and 54.0 percent in NZDep2013 quintile level 2 areas, compared with 46.1 percent for those living in NZDep2013 quintile level 5 area).
The proportions for NZDep2013 quintile levels 3 and 4 areas were 53.5 percent and 52.9 percent respectively.
Regional differencesTop
In 2013/2014, people living in Canterbury were most likely to have met physical activity guidelines (77.0 percent), followed by Otago/Southland (72.6 percent).
Those living in Auckland (43.2 percent) and Taranaki (43.3 percent) were least likely to be physically active for at least 30 minutes on five or more days in the last week.
Data for this section can be found at: www.socialreport.msd.govt.nz/documents/2016/h9.xlsx
