Paid work
Satisfaction with work-life balance
Definition
The proportion of employed people who were “very satisfied” or “satisfied” with their work-life balance.
RelevanceTop
It is important that people find a balance between paid work and other aspects of their lives. When this balance is not found, people may suffer from stress or anxiety. Long working hours or non-standard working hours may compromise work-life balance. This indicator is based on information from the Survey of Working Life, a supplement to the Household Labour Force Survey run in 2008 and 2012.
Current level and trendsTop
In 2012, 78.0 percent of employed people aged 15 years and over were very satisfied or satisfied with their work-life balance. This was slightly above the level in 2008 (76.2 percent). Fewer than one in ten (8.4 percent) employed people were dissatisfied or very dissatisfied with their work-life balance in 2012.
Those working full-time (30 hours or more per week) were less likely than those working part-time (less than 30 hours per week) to be very satisfied or satisfied with their work-life balance (75.2 percent and 86.6 percent respectively in 2012). The percentage of those who were very satisfied or satisfied with their work-life balance declined as hours worked rose, dropping from 87.9 percent for those working 0–19 hours to 60.4 percent for those working 50 hours or more.
Figure PW6.1 – Proportion of employed people by level of satisfaction with work-life
balance, 2008 and 2012
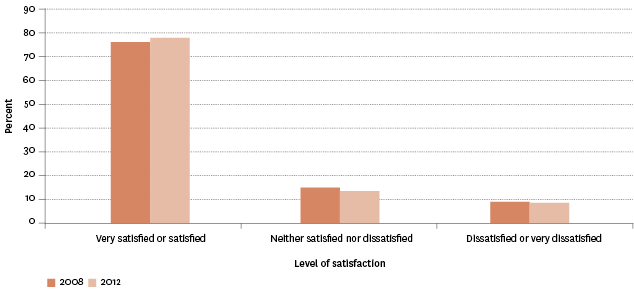
Source: Statistics New Zealand, Survey of Working Life
Age and sex differencesTop
Females were slightly more likely than males to be very satisfied or satisfied with their work-life balance in both 2008 and 2012. In 2012, 78.6 percent of females were very satisfied or satisfied with their work-life balance, compared with 77.5 percent of males. Of interest is that females were also slightly more likely than males to be dissatisfied or very dissatisfied with their work-life balance in 2012 (9.0 percent and 7.9 percent respectively). These results, in part, reflect that males were more likely than females to be neither satisfied nor dissatisfied (14.6 percent and 12.4 percent respectively).
In 2012, employed people aged 65 years and over were most likely to be very satisfied or satisfied with their work-life balance (91.3 percent), followed by those aged 15–24 years (81.3 percent). Those aged 35–44 years were least likely to be very satisfied or satisfied with their work-life balance (75.2 percent).
Table PW6.1 – Proportion of employed people who were very satisfied or satisfied with their
work-life balance, by age group and sex, 2012
| 15–24 | 25–34 | 35–44 | 45–54 | 55–64 | 65+ | 15+ | |
|---|---|---|---|---|---|---|---|
| Male | 81.0 | 77.8 | 73.1 | 74.7 | 78.8 | 90.3 | 77.5 |
| Female | 81.7 | 78.3 | 77.5 | 76.2 | 77.9 | 92.9 | 78.6 |
| Total | 81.3 | 78.0 | 75.2 | 75.4 | 78.4 | 91.3 | 78.0 |
Source: Statistics New Zealand, Survey of Working Life 2012
Ethnic differencesTop
While satisfaction with work-life balance shows a fairly similar pattern across ethnic groups, in 2012, Māori, followed by European/Other, were least likely to be very satisfied or satisfied with their work-life balance (76.0 percent and 77.3 percent respectively). The Asian ethnic group and Pacific peoples were most likely to be very satisfied or satisfied with their work-life balance (83.1 and 82.8 percent respectively). The opposite pattern is found for those dissatisfied or very dissatisfied with their work-life balance.
Figure PW6.2 – Proportion of employed people who were very satisfied or satisfied with
their work-life balance, by ethnic group, 2012
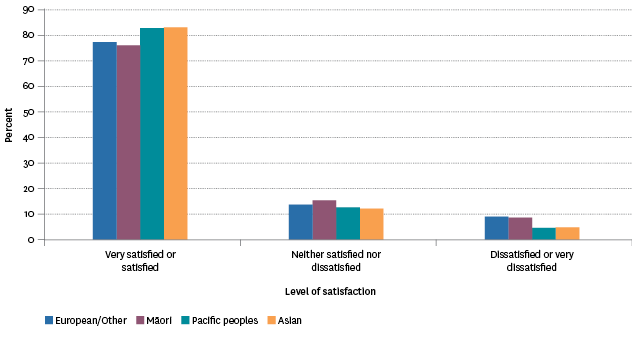
Source: Statistics New Zealand, Survey of Working Life
Occupational and employment relationship differencesTop
In 2012, managers and professionals had the lowest proportion who were very satisfied or satisfied with their work-life balance (73.1 and 75.7 percent respectively). Clerical and administrative workers, and community and personal service workers, had the highest proportion who were very satisfied or satisfied with their work-life balance (84.8 percent and 81.0 percent respectively).
In terms of employment relationship, employers were least likely to be very satisfied or satisfied with their work-life balance (69.5 percent), while temporary employees were most likely (79.9 percent).
Figure PW6.3 – Proportion of employed people who were very satisfied or satisfied with
their work-life balance, by occupation, 2012
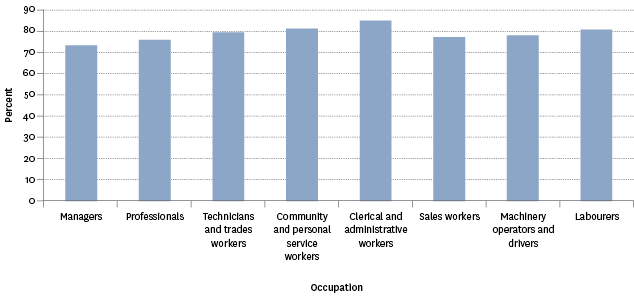
Source: Statistics New Zealand, Survey of Working Life
Regional differencesTop
Wellington had the lowest proportion of people very satisfied or satisfied with their work-life balance (75.4 percent), while Taranaki had the highest (80.5 percent).
International comparisonTop
There is not a directly comparable international measure for work-life balance but the OECD does provide a measure based on working very long hours, which results in much lower levels of satisfaction with work-life balance. In 2013, 13.9 percent of New Zealand employees usually worked 50 hours or more per week, ranking New Zealand 25th highest out of 30 OECD countries. The rate for New Zealand compared with 14.0 percent in Australia, 12.7 percent for Great Britain and 11.3 percent for the United States, but was much higher than the OECD median of 6.1 percent.
Data for this section can be found at: www.socialreport.msd.govt.nz/documents/2016/PW6.xlsx
