Safety
Criminal victimisation
Definition
The proportion of the population aged 15 years and over who said they had a crime committed against them in the last 12 months.
RelevanceTop
The criminal victimisation rate provides a broad measure of personal safety and wellbeing.
Current level and trendsTop
In 2014, 13.4 percent of the population aged 15 years and over said they had a crime committed against them in the last 12 months, as measured by the New Zealand General Social Survey (NZGSS).
Figure SS1.1 – Proportion of population aged 15 years and over who had a crime
committed against them in the last 12 months, 2008–2014
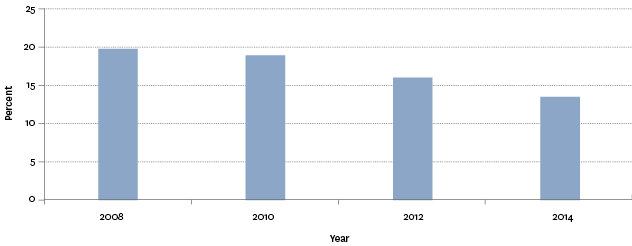
Source: Statistics New Zealand, New Zealand General Social Survey
In 2012, the NZGSS looked further into those crimes committed against people. Four in ten people (39.9 percent) who had a crime committed against them had experienced multiple crimes in 12 months, while 13.1 percent of them had experienced violence. Those aged 15–24 years and Māori and Pacific peoples appeared to be more likely to experience multiple crimes and violent crime.
Those who experienced violent crime were most likely to experience emotional hurt or severe distress (48.5 percent). A physical injury or health problem (32.7 percent), or costs to cover or things to repair or replace (29.2 percent), were also commonly experienced. However, violent crime had no impact on one in five people (18.7 percent) who experienced it.
About half of those who had experienced a violent crime (49.2 percent) said that it had had no effect on their quality of life, while 13.3 percent said that it had made their quality of life better in the end. Approximately four in ten (37.5 percent) said the violent crime had made their quality of life worse, with 8.3 percent saying it had made their quality of life significantly worse.
Age and sex differencesTop
In 2014, males and females had similar experiences, with 14.6 percent of males reporting having had a crime committed against them in the past 12 months, compared with 12.3 percent of females. This pattern was also present in previous years.
Older people were less likely than younger people to be victims of crime – 6.7 percent of those aged 65 years and over reported this in 2014, compared with 15.9 percent of those aged 15–24 years. This relationship was also found across the other survey periods.
Table SS1.1 – Proportion of population aged 15 years and over who had a
crime committed against them in the last 12 months, by age group and sex, 2008–2014
| 15–24 | 25–34 | 35–44 | 45–54 | 55–64 | 65+ | |
|---|---|---|---|---|---|---|
| 2008 | ||||||
| Male | 25.9 | 16.9 | 23.7 | 24.6 | 17.3 | 14.5 |
| Female | 21.5 | 25.3 | 21.2 | 18.7 | 14.0 | 8.0 |
| Total | 23.7 | 21.2 | 22.4 | 21.6 | 15.7 | 11.0 |
| 2010 | ||||||
| Male | 22.6 | 21.3 | 21.4 | 19.6 | 21.0 | 9.6 |
| Female | 21.2 | 24.2 | 20.1 | 19.4 | 12.1 | 10.7 |
| Total | 22.0 | 22.7 | 20.7 | 19.5 | 16.4 | 10.2 |
| 2012 | ||||||
| Male | 21.7 | 22.3 | 15.5 | 14.4 | 14.1 | 11.9 |
| Female | 17.2 | 15.9 | 18.8 | 19.1 | 12.7 | 5.9 |
| Total | 19.5 | 19.0 | 17.2 | 16.8 | 13.4 | 8.7 |
| 2014 | ||||||
| Male | 17.8 | 17.9 | 17.8 | 14.1 | 12.4 | 7.1 |
| Female | 14.0 | 15.4 | 13.6 | 14.1 | 10.8 | 6.4 |
| Total | 15.9 | 16.6 | 15.6 | 14.1 | 11.6 | 6.7 |
Source: Statistics New Zealand, New Zealand General Social Survey
Ethnic differencesTop
In 2014, Māori were most likely to say they had a crime committed against them in the last 12 months (18.6 percent), followed by European/Other (13.7 percent) and Pacific peoples (12.5 percent). Those in the Asian ethnic group were least likely to report being victims of crime (10.6 percent).
All ethnic groups, except for Pacific peoples, showed a steady decrease over time in being victims of crime.
Figure SS1.2 – Proportion of population aged 15 years and over who had a crime
committed against them in the last 12 months, by ethnic group, 2008–2014
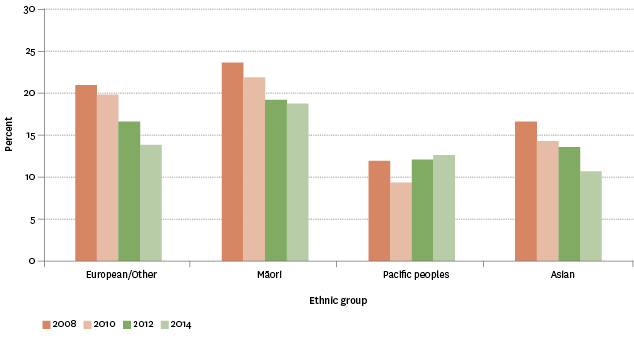
Source: Statistics New Zealand, New Zealand General Social Survey
Socio-economic differencesTop
The proportion of people who had a crime committed against them increased as their material wellbeing decreased. In 2014, 10.1 percent of people in the higher material wellbeing index category reported being victims of crime, compared with 21.3 percent of people in the lower material wellbeing index category. The levels for people in the lower middle material wellbeing index category and upper middle category were 15.3 percent and 11.9 percent respectively.
However, the same pattern was not found when looking at personal income levels. In 2014, there was only a small difference in experiences of crime by income level: 12.5 percent of people with a personal income of $30,000 or less said they were a victim of crime, compared with 14.5 percent for those in the $30,001-$70,000 income group and 13.8 percent for those in the $70,001 and over income group.
Labour force status differencesTop
In 2014, those not in the labour force (eg retired, studying, caring for others) were less likely to say they were a victim of crime compared with other groups (9.7 percent, compared with 14.8 percent of employed people and 17.8 percent of unemployed people).
Family type differencesTop
People in sole-parent families were more likely to say they had a crime committed against them, compared with other family types. In 2014, 20.4 percent of people living in sole-parent families reported being a victim of crime, compared with 13.5 percent each of people living in a couple with children and people not in a family nucleus, and 10.9 percent of people living in a couple without children.
Migrant status differencesTop
In 2014, migrants who had arrived in New Zealand in the last five years (9.5 percent) had lower proportions experiencing crime, compared with people born in New Zealand (14.2 percent) and longer-term migrants (11.7 percent).
Regional differencesTop
Gisborne (20.6 percent) and Northland (19.8 percent) had the highest proportions of people who reported they were a victim of crime. Taranaki (6.8 percent) and Southland (12.2 percent) had the lowest proportions.
Data for this section can be found at: www.socialreport.msd.govt.nz/documents/2016/ss1.xlsx
