Social wellbeing summary
Recent-change and medium-term-change
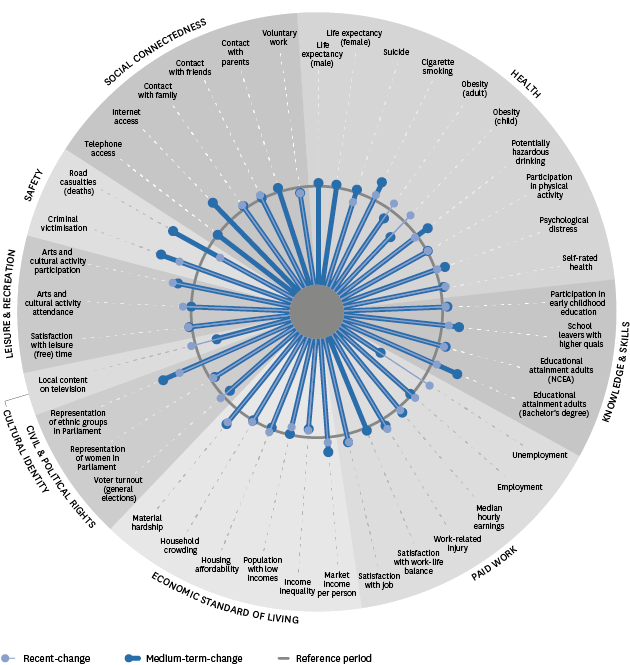
In the Health domain, life expectancy at birth for males and females showed improvements in terms of medium-term-change, while self-rated health showed improvements for recent-change and medium-term-change. Obesity rates for adults and children were stable when looking at recent-change, but increased for medium-term-change. While the cigarette smoking rate had not changed recently, it decreased in terms of medium-term-change. Psychological distress, potentially hazardous drinking, suicide, and participation in physical activity showed stable results for recent-change and medium-term change.
There were improvements in recent-change and medium-term-change for many of the Knowledge and Skills indicators: participation in early childhood education; school leavers with higher qualifications; and educational attainment of adult population (NCEA and Bachelor’s).
In the Paid Work domain, satisfaction with work-life balance increased in terms of medium-term-change. There were stable recent-change results for median hourly earnings, work-related injury and job satisfaction, though all showed improvements when looking at medium-term-change. Unemployment and employment rates improved when looking at recent-change, but worsened for medium-term-change.
Most indicators in the Economic Standard of Living domain had steady results when looking at recent-change and medium-term-change. This included income inequality, the population with low incomes, housing affordability, and household crowding. In comparison, market income per person and the proportion of households facing material hardship improved in terms of recent-change and medium-term-change.
In the Civil and Political Rights domain, representation of women in Parliament was stable for recent-change and medium-term-change. However, representation of ethnic groups in government improved in the two time periods. Voter turnout in general elections decreased when looking at medium-term-change, though turnout increased when looking between the most recent general elections.
Local content programming on New Zealand television in the Cultural Identity domain showed stable results for recent-change, but a decrease in terms of medium-term-change.
In the Leisure and Recreation domain, active participation in arts and cultural activities showed improvement when looking at recent-change and medium-term-change, while attendance in arts and cultural activities had an increase in recent-change but there was no medium-term-change. People’s satisfaction with leisure time was stable when looking at recent-change and medium-term-change.
The proportion of people experiencing criminal victimisation in the Safety domain decreased for both recent-change and medium-term-change. While road casualties (deaths) showed an improvement in terms of medium-term-change, there was an increase in death rates in recent-change.
In the Social Connectedness domain, results were stable in terms of recent-change and medium-term-change for contact with family and friends, and people undertaking voluntary work. Telephone access in the household and contact between young people and their families were stable in terms of medium-term-change. Internet access in the household, in comparison, increased for the same time period.
Figure SU1.1 – Recent-change and medium-term-change for social wellbeing
outcomes for selected indicators
Interpreting “Recent-change and medium-term-change for social wellbeing outcomes for selected indicators”
Note: In some cases for medium-term-change the data is averaged over the three years in each period. The absence of medium-term-change data for some indicators limits the number of indicators that can be displayed. For the following indicators, the recent-change and medium-term-change are the same period due to the nature of the data collection: Life expectancy, satisfaction with work-life balance, telephone and internet access in the household, contact between young people and parents (these indicators show only medium-term-change). Limitations: This style of presentation means that direct comparisons in the size of changes for different indicators cannot be made. Users should refer to the indicator section for more information. While a radial chart may indicate a change or difference in outcomes, the change may not be statistically significant. This will often be true for indicators that fall on, or close to, the central circle. |
|---|
 references outcomes for each indicator for the period directly before the most recent data points available for that indicator (2005–2013).
 represent changes between the most recent period and the period directly before this.
 represent changes between the most recent period and the set period (2005–2008).