Drinking water quality
Definition
The percentage of the surveyed population who receive their water from community water supplies, whose drinking water complies with the 2000 Drinking Water Standards of New Zealand relating to E. coli and Cryptosporidium. About 87 percent of the New Zealand population drink water from community supplies. 77
Relevance
Maintaining good drinking water quality is critical for human health and quality of life outcomes. The health risk to consumers from water-borne disease in drinking water supplies comes from two main types of microorganisms: bacteria (such as faecal coliforms and E. coli) and parasites (such as Giardia and Cryptosporidium). Improvements in this indicator suggest that less of the population is at risk of water-borne disease and other contaminants.
Current level and trends
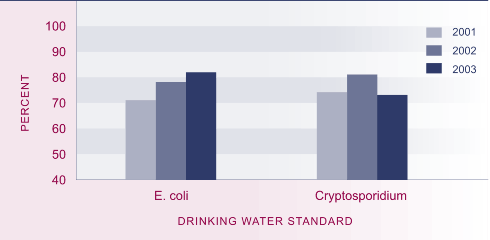
The majority of New Zealanders are supplied with community drinking water that complies with the microbiological standards. However, many smaller communities are supplied with microbiologically non-compliant drinking water. The surveyed proportion whose drinking water, measured at the tap, complies with the 2000 drinking water standards regarding E. coli has increased over the past three years, from 71 percent in 2001, to 78 percent in 2002, to 82 percent in 2003. Most water supplies serving large population areas are fully compliant with the 2000 standards. A significant reason for non-compliance is inadequate monitoring rather than the actual contamination of drinking water.
Compliance with the 2000 drinking water standards for Cryptosporidium is measured at the water treatment plant rather than at the tap. Cryptosporidium compliance has fluctuated over this period, from 74 percent in 2001, to 81 percent in 2002, to 73 percent in 2003. The decrease in compliance from 2002 to 2003 is largely due to non-compliance at the Waitakere plant which has since been resolved.
Figure EN2.1 Proportion of the surveyed population served with water that meets the 2000 drinking water standards, 2001–2003

Source: Ministry of Health (2005b)
Note: Previous editions of the social report used the, now out-dated, 1995 Drinking Water Standards of New Zealand, rather than the 2000 Drinking Water Standards of New Zealand
Regional differences
Groundwater sources supply drinking water for approximately 40 percent of the New Zealand population, while about 60 percent of people are supplied from source (catchment) water. Most water in catchment headwaters is of good quality. Lower down the catchment where farming and intensive land use occurs (for example horticulture), water quality deteriorates. Problems with the quality of some groundwater sources have also been identified.
There is considerable regional variation in the population served with drinking water that is fully compliant. In 2003, only 1 percent of the population in Marlborough was served with drinking water that fully complied with the 2000 drinking water standards. Otago and the Wairarapa also had low compliance rates, with 25 percent and 27 percent of the population covered. Compliance was highest in the Manawatu (94 percent), followed by Auckland (85 percent), South Canterbury (81 percent) and Tauranga (80 percent). A major reason for non-compliance is inadequate monitoring, rather than actual contamination.
Where drinking water quality is affected, the agricultural sector is seen as the most important source of water quality problems. 78
International comparison
Overall, the quality of New Zealand water is high by international standards. New Zealand 's water supplies are free of many of the diseases that result in sickness and death in other countries. However, the incidence of infection from Giardia in water supplies is 85 per 100,000 people, which is considered high compared to the reported rates for other western countries. 79
|

