Voter turnout
Definition
General elections: The proportion of the estimated voting-age population (aged 18 years and over) who cast a vote in general elections.
Local authority elections: The proportion of all enrolled electors (both resident and ratepayer) who cast a vote in contested local authority elections.
Relevance
Voter turnout rates are an indicator of the extent to which citizens participate in the political process, and the confidence the population has in, and the importance they attach to, political institutions.
Current level and trends
1. General elections
Voter turnout of the eligible population in 2005 was 77 percent. Voter participation in general elections declined sharply from 89 percent in 1984 to 78 percent in 1990, increased slightly to 81 percent in 1996, then declined again to a new low of 72.5 percent in 2002. In 2005, the turnout recovered to the level recorded in the 1999 election.
Figure CP1.1 Proportion of estimated voting-age population who cast votes, 1984–2005
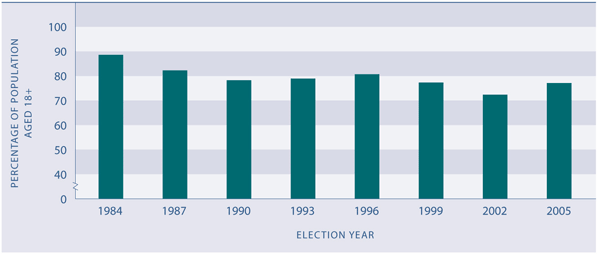
Sources: Electoral Commission (2002); Electoral Commission (2005)
Note: 1984 and 2005 figures calculated by the Ministry of Social Development
Age, sex, ethnic and socio-economic differences
Because of the nature of the secret ballot, information on differences in participation rates among various sectors of the New Zealand population is not directly available. Nevertheless, results from New Zealand election surveys over a number of years show non-voters are more likely to be people on lower incomes, younger people and members of Māori or Pacific ethnic groups. There are few differences in voter turnout rates between men and women.
Regional differences
There are few discernible differences in voter turnout rates between rural and urban voters, although non-voting tends to be lowest in provincial cities.
International comparison
Using a different definition of voter turnout (the proportion of the registered population who voted), New Zealand was ranked eighth out of 30 OECD countries with a voter turnout rate of 81 percent in 2005.77 The New Zealand rate was higher than the OECD median of 71 percent for recent elections, but lower than that of Australia, where voting is compulsory (95 percent in 2007). Countries with lower voter turnout rates than New Zealand included the United States (69 percent in 2004), Canada (65 percent in 2006), and the United Kingdom (62 percent in 2005).
Current level and trends
2. Local authority elections
Voter turnout in the 2007 local authority elections was 44 percent. This was the lowest voter turnout since 1989. A major restructuring of local government in 1989 was initially accompanied by a noticeable increase in voter turnout, peaking at 61 percent in 1992. Voter turnout has declined steadily since then, with the exception of the 1998 elections.
The drop in voter turnout between 2004 and 2007 was relatively constant across all local authority types, with falls of two or three percentage points.
In 2007, there were 249 elected local authorities in New Zealand: 12 regional councils, 21 district health boards, 16 city councils, 57 district councils and 143 community boards.
Table CP1.1 Voter turnout (%) in local authority elections, 1989–2007
| |
1989 |
1992 |
1995 |
1998 |
2001 |
2004 |
2007 |
| Regional councils |
56 |
52 |
48 |
53 |
49 |
45 |
43 |
| District health boards |
– |
– |
– |
– |
50 |
46 |
43 |
| Territorial authorities |
| City councils |
52 |
48 |
49 |
51 |
45 |
43 |
41 |
| City mayors |
50 |
48 |
49 |
51 |
45 |
43 |
41 |
| District councils |
67 |
61 |
59 |
61 |
57 |
51 |
49 |
| District mayors |
67 |
61 |
59 |
59 |
56 |
52 |
49 |
| Community boards |
54 |
49 |
50 |
50 |
46 |
42 |
41 |
Source: Department of Internal Affairs (2006) Table 3.3 and unpublished data for 2007
Note: District health boards were established in 2001
The 2007 results continued the pattern of previous local authority elections, with small and South Island communities tending to register a higher voter turnout across all elected local authority types. The highest voter turnout in regional council elections was for the West Coast Regional Council (57 percent), followed by the Tasman District Council (55 percent). Turnouts tended to be lowest in regions with large urban centres – Waikato, Auckland, Wellington and Canterbury had the lowest voter turnout rates, ranging between 37 percent and 44 percent.
Local authority voter turnout is highest for district councils, with their more rural population base, especially those in the South Island. In the 2007 district council elections, voter turnout in the South Island was 53 percent, compared with 47 percent in the North Island. Smaller regional councils and small district health boards also attracted a higher voter turnout than larger local authorities. Voter turnout rates ranged from 54 percent for small district councils to 39 percent for large city councils. |
