Assault mortality
Definition
The number of people who have died as the result of an assault, per 100,000 population.
Relevance
Reducing interpersonal violence in families and communities is critical to social and personal wellbeing. This indicator measures deaths resulting from violence, the tip of the violence pyramid. Young children and youth are particularly vulnerable.
Current level and trends
In the five years to 2005, 296 people died as the result of an assault, a decline from 300 people in 1996–2000, 316 people in 1991–1995, and 346 people in 1986–1990.
The provisional age-standardised assault mortality rate for the year 2005 was 1.7 per 100,000 population, up from 1.2 per 100,000 in 2004. In the early-1980s, the assault mortality rate was around 1.5 per 100,000. It increased to around 2.0 per 100,000 between 1986 and 1992, falling back to around 1.5 per 100,000. It should be noted that rates based on small numbers are volatile, and trends can be difficult to discern over the short term.
Figure SS1.1 Age-standardised assault mortality rate, by sex, 1980–2005
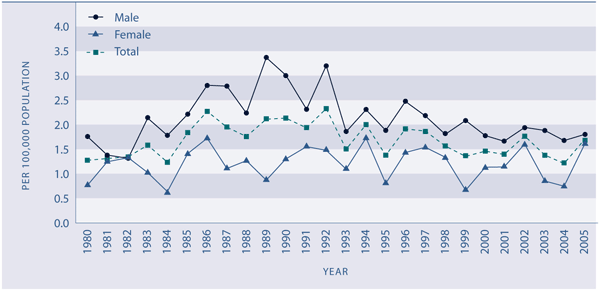
Source: Ministry of Health, New Zealand Health Information Service
Note: 2005 data is provisional
Age and sex differences
Five-year average annual assault death rates for the period 2001–2005 were highest among youth aged 15–24 years (2.2 deaths per 100,000), followed by adults aged 25–44 years (2.0 per 100,000) and those aged 45–64 years (1.3 per 100,000). Children under 15 years and older people aged 65 years and over had the lowest rates (0.8 and 0.9 per 100,000 respectively). For children, the risk of dying from an assault is highest at younger ages. In the five years to 2005, the assault death rate for children under 5 years was 1.6 deaths per 100,000, more than three times higher than the rate for 5–14 year olds (0.5 per 100,000). In all age groups, rates were lower in the period 2001–2005 than they had been in the late 1980s.
Males are more likely than females to die from an assault. The provisional 2005 age-standardised death rate was 1.8 per 100,000 for males, and 1.6 per 100,000 for females. The rise in the assault mortality rate in the late-1980s and early-1990s was the result of an increase in the male rate in that period.
Figure SS1.2 Five-year average annual assault mortality rates, by age, 1986–1990 to 2001–2005
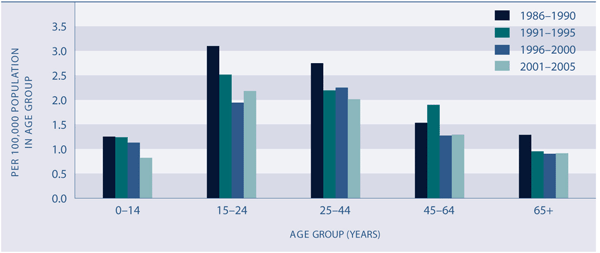
Source: Ministry of Health, New Zealand Health Information Service
Ethnic differences
Māori are considerably more likely than non-Māori to die as the result of an assault. In 2005, the age-standardised rate for Māori was 3.5 deaths per 100,000 compared with 1.2 per 100,000 for non-Māori. The age-standardised rate for Māori males (4.1 per 100,000) was higher than the rate for Māori females (3.0 per 100,000).
In the five years from 2001 to 2005, Māori children aged under 15 years died from an assault at an average annual rate of 1.5 per 100,000 children. Over the same period, non-Māori children died at an average annual rate of 0.6 per 100,000 children.
International comparison
OECD homicide rates are standardised to the 1980 OECD population and differ from the rates shown in this indicator. In 2003, the average homicide death rate for 27 OECD countries was 1.8 per 100,000 for males and 0.9 per 100,000 for females. New Zealand homicide rates were lower than the OECD average for males (1.7 per 100,000) and higher than average for females (1.1 per 100,000). New Zealand’s male homicide rate was the same as Australia’s but lower than Canada’s (2.0 deaths per 100,000) and higher than the United Kingdom’s (0.7 per 100,000). New Zealand had a higher female homicide rate than Canada (1.0 deaths per 100,000), Australia (0.9 per 100,000) and the United Kingdom (0.2 per 100,000). Death rates from homicide are highest in the United States; the rate for males in 2003, at 9.7 per 100,000, was five times greater than the OECD average, while the female rate of 2.6 per 100,000 was three times greater.
International comparison information for child maltreatment deaths is not available on an annual basis. Results of a 2003 UNICEF study of child maltreatment deaths in rich countries in the 1990s showed that New Zealand had the third highest child maltreatment death rate (1.2 per 100,000 children under the age of 15 years). |
