Relevance
Leisure time is a crucial component of a balanced and healthy lifestyle. It is a time when people can do what they want, separate from work and other commitments. New Zealanders' subjective feelings about their leisure time provide information on how people feel about both the quality and quantity of their leisure.
Current Level And Trends
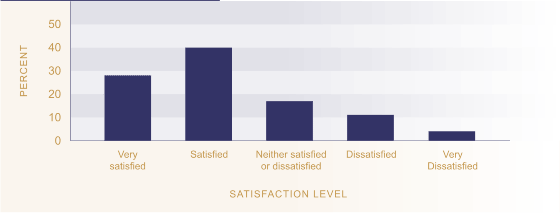
According to the Social Wellbeing Survey 2004, just over two-thirds of New Zealanders (68 percent) are satisfied overall with their leisure. Specifically, 40 percent are 'satisfied' and 28 percent are 'very satisfied'.
Figure L1.1 Satisfaction with leisure,
2004

Source: Ministry of Social
Development (2004)
Age Differences
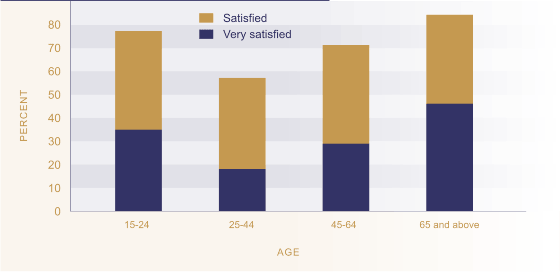
While over half of New Zealanders are satisfied with their leisure time, those aged between 25 and 44 years are less satisfied overall (57 percent). This age group tends to have larger work and family commitments than other groups, which may impinge on the time they have available for leisure. In comparison, those aged between 46 and 64 years and 15 and 24 years are more likely to report being satisfied with their leisure time with total satisfaction levels of 71 percent and 78 percent respectively. Those aged over 60 report the highest levels of overall satisfaction with their leisure time (84 percent).
Sex Differences
There are minimal differences in reported satisfaction with leisure time between the sexes. Sixty-nine percent of both men and women report that they are satisfied with their leisure time.
Figure L1.2 Levels of satisfaction with
leisure, by age, 2004

Source: Ministry of Social
Development (2004)
Ethnic Differences
Most New Zealanders, regardless of ethnicity, are satisfied overall with their leisure time. The European ethnic group reports the highest level of total satisfaction (70 percent), followed by those of Other ethnic groups (65 percent), Māori (66 percent) and Pacific peoples (64 percent).
Personal Income Differences
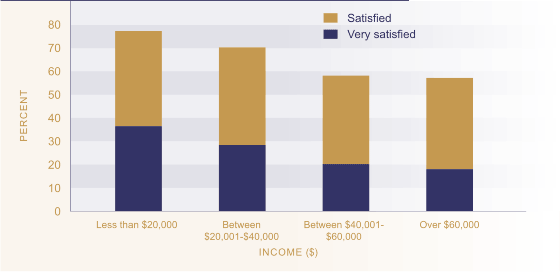
As income increases the proportion of people reporting satisfaction with their leisure time tends to decrease. Seventy-seven percent of people with incomes of less than $20,000 report that they are 'very satisfied' or 'satisfied' with their leisure-time, compared to 57 percent of those earning over $40,000. As income increases to between $20,000 and $40,000, satisfaction levels decrease to 70 percent. Satisfaction levels continue to decrease for New Zealanders who are earning over $40,000 (57 percent) and remain at this level for incomes over $60,000.
Figure L1.3 Levels of satisfaction with
leisure, by personal income, 2004

Source: Ministry of Social
Development (2004)
