Paid Work
OUTCOMES
Access to meaningful, rewarding and safe employment is available to all.
INTRODUCTION
Income from paid work is a primary determinant of living standards for the great majority of New Zealanders. Approximately two-thirds of total household income is derived directly from labour market income and the figure is substantially greater for most households. Income saved during working life contributes to the standard of living of many retired people.
Paid work is also an important way for people to participate in society, attain social status and enjoy a sense of social connectedness. Those who experience unemployment, particularly long-term or recurrent unemployment, can become isolated from society and their community and often lose self-confidence. Substantial evidence from New Zealand and overseas suggests that unemployment is associated with poorer mental and physical health. It is important, too, that people have access to jobs that match their training, skills and experience and fit with their career aspirations.
Several inter-related factors affect the number and types of jobs in the economy at any one time. These include the demand for and supply of skills, and the processes that match demand with supply. Economic conditions here and internationally, investment decisions, and actions by government all affect skill demand. People's and businesses' training and education decisions, migration flows and individuals' decisions on how much time to allocate to paid work all influence skill supply. In making decisions regarding paid work, individuals take into account factors such as likely wages, childcare responsibilities and costs, and other activities such as voluntary work and leisure pursuits.
These important interactions highlight the links between the indicators in this domain and those in others, particularly the Knowledge and Skills and Economic Standard of Living indicators. The first two indicators chosen for this chapter - the unemployment rate and the employment rate - together provide a picture of trends in the labour market. The unemployment rate measures those who are out of work, actively seeking a job and available to take up work.
The employment rate measures the percentage of people in employment and is influenced by trends in labour force participation as well as in unemployment.
There are many ways of measuring unemployment. The indicator selected here is the one that most closely accords with the OECD standardised measure. It is, however, a comparatively narrow definition. A broader measure, known as the "jobless" rate, includes people who are unemployed but do not meet the stricter unemployment rate definition because they are either not available for work immediately or were not actively seeking employment at the time of the survey. The jobless rate is typically 50-70 per cent higher than the official unemployment rate.
Both indicators focus on the quantity of employment and unemployment and the way these are spread across different groups in the community. Ideally these measures would be supplemented by measures of the quality of paid work - how "good" the available jobs are, including how satisfied people are with their employment situation. Unfortunately no robust data currently exists in these areas. The third indicator provides a measure of one aspect of job quality - the rate of workplace injury claims. Safety at work is a vital contributor to well-being.
KEY POINTS
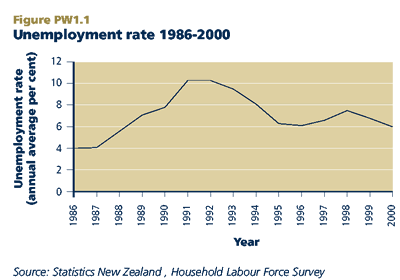
- Unemployment increased sharply between 1987 and 1991. It fell between 1992 and 1996, rose slightly in 1997-98, and has been falling over the past two years. Most forecasters are predicting further small declines in unemployment over the next two to three years to around five per cent. This rate is still above the rate of four per cent that existed in the mid-1980s.
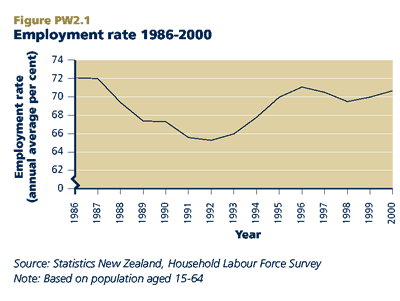
- The employment rate shows that currently almost 71 per cent of those aged 15-64 are in paid work. This is substantially higher than the 65 per cent employed in 1992, but still below the 72 per cent figure of 1986. Women's employment rate is substantially below that of men, although this gap has been narrowing over the last few decades as more women participate in the paid labour force.
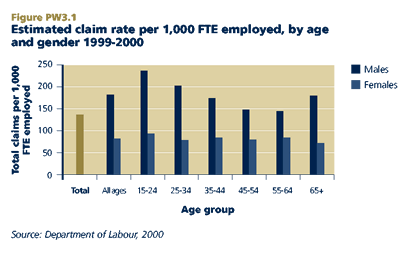
- The rate of workplace injury claims averaged 140 claims per 1,000 full-time equivalent employees in the 1999/2000 year. Men are more than twice as likely as women to suffer workplace injuries, a fact associated with the types of industries and occupations men are more likely to work in.
SUMMARY
Both employment indicators show a generally improving trend over recent years, but the situation has not yet returned to 1986 levels. Compared with other OECD countries, New Zealand's unemployment rate is now average.
Unemployment continues to be unevenly distributed across different groups in the community. In particular, although Māori and Pacific peoples' unemployment rates have fallen since 1992, both rates remain considerably higher than the European/Pakeha unemployment rate. Within groups, the prevalence of unemployment is also unequally shared. While a large number of people are unemployed at some point in their lives, the experience of unemployment is concentrated in a relatively small proportion of the community who are unemployed for long periods of time or experience repeated spells of unemployment. Long-term and repeated unemployment has the most serious social and economic consequences and is associated with low economic standards of living and potentially negative impacts on children. It can also lead to a depreciation in skills, alienation from the labour market and a decline in self-confidence and self-esteem. Regional differences in employment outcomes, while narrower than a decade ago, continue to be significant. Moreover, the data on broad regional classifications reported below hides the much greater variations in employment and unemployment rates that exist at local level.
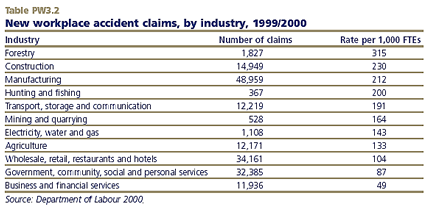
Work-related accident data shows some industries, such as forestry, construction and manufacturing have particularly high accident rates. There were 59 fatal accident claims in 1999/2000 - almost two-thirds in the forestry, fishing and agriculture; construction; and transport industries.
Unemployment
DEFINITION
The number of people, aged 15 and over, who are not employed and are actively seeking and available for paid work, expressed as a percentage of the total labour force. (The labour force is defined as those aged 15 and over who are employed, plus those who meet the definition of unemployed.)
RELEVANCE
A key indicator of labour market outcomes and lack of access to employment. The unemployment rate is an important reflection of overall economic conditions and of the ease with which people are able to move into employment.
CURRENT LEVEL AND TRENDS
Over the 2000 year, the New Zealand unemployment rate averaged six per cent, or 113,400 people unemployed. The unemployment rate rose from four per cent in 1987 to 10.3 per cent in 1991. It has fallen every year since, except for a small increase over 1997-98, but remains higher than the period up to the late 1980s.
Approximately 34 per cent of the surveyed unemployed have been unemployed for a continuous period of six months or more. This compares with around 17 per cent in 1986. At its peak in 1993, the proportion of long-term unemployed was much higher, at over 53 per cent
ETHNIC DIFFERENCES
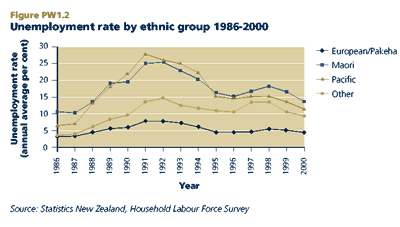
Substantial differences in unemployment rates persist for different ethnic groups. Since 1986, Māori unemployment has risen from 10.7 per cent to a peak of 25.4 per cent in 1992. During 2000 it averaged 13.7 per cent. The unemployment rate among Pacific peoples was 6.5 per cent in 1986, rising to 27.9 per cent in 1992 and falling to 11.4 per cent in 2000. Unemployment among Europeans/Pākehā is much lower - rising from 3.5 per cent in 1986 to 7.9 per cent in 1991-1992 before falling to 4.5 per cent in 2000.
The unemployment rate among the "Other" ethnic category (which comprises predominantly people of Chinese and Indian ethnicity and includes many recent migrants) increased from 3.6 per cent in 1986 to 14.7 per cent in 1991, before falling to 9.7 per cent in 2000.
AGE AND GENDER DIFFERENCES
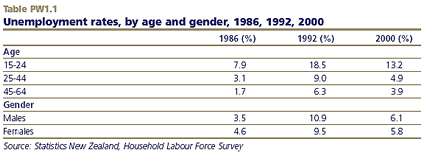
Unemployment rates among different age groups have followed a common trend but the level among those aged 15-24 has been consistently more than twice the rate for older groups. The unemployment rate for young people averaged 13.7 per cent in 2000 and this group comprised 39 per cent of all unemployed. Unemployment rates for males and females are about equal. Approximately 44 per cent of all unemployed are women.
REGIONAL DIFFERENCES
In 2000, regional unemployment rates varied from 8.8 per cent in Northland and 7.6 per cent in the Bay of Plenty to 4.9 per cent in Tasman-Nelson-Marlborough-West Coast and 5.3 per cent in Wellington. While still substantial, these disparities are smaller than they were at the beginning of the 1990s when unemployment was higher.
INTERNATIONAL COMPARISONS
Over the last 15 years, the New Zealand unemployment rate has ranged from being one of the lowest in the OECD, to well above average by 1992, to around or just below average over the last four years. In 1999, New Zealand's standardised unemployment rateof 6.8 per cent ranked 12th out of 23 OECD countries, behind the United States (4.2 per cent), Japan (4.7 per cent) and the United Kingdom (6.1 per cent), and ahead of Australia (7.2 per cent).
Employment
DEFINITION
The proportion of all people aged 15-64 years who are in paid employment for at least one hour per week.
RELEVANCE
The employment rate is the best available indicator of the prevalence of paid employment. It captures trends in both unemployment and labour force participation.
CURRENT LEVEL AND TRENDS
Over 2000, the surveyed employment rate averaged 70.7 per cent with an average 1,779,000 people in work. The employment rate has been rising since 1992, except during the economic downturn in 1997 and 1998. The 2000 employment rate, however, remains lower than the 72.1 per cent rate of 1986. The increase from 65.3 per cent in 1992 to 70.7 per cent in 2000 corresponds to a rise of 304,100 in the number of employed people. Over the same period the total number of people aged 15-64 increased by 242,900.
ETHNIC DIFFERENCES
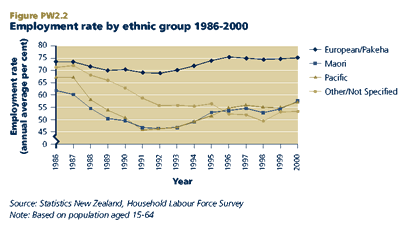
The proportions of the European/Pākehā, Māori and Pacific working age populations in employment all fell between 1987 and 1992 and have risen since then. The employment rate among Europeans/Pākehā is now equal to the 1987 rate, while the rates for Māori and for Pacific peoples remain substantially below their 1987 levels. There is currently a difference of 8.4 and 9.4 percentage points between the European/Pākehā and the Māori and Pacific peoples' employment rates respectively. The employment rate for the "Other" ethnic category has fallen from being the highest in the late 1980s to the lowest in the late 1990s, reflecting the impact of migration and the difficulties experienced by some newer migrants in integrating into the New Zealand labour market.
AGE AND GENDER DIFFERENCES
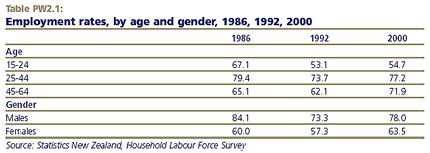
The employment rate decline between 1987 and 1992 affected all age groups, but was most pronounced for young people. Youth employment rates have remained relatively low during the period of employment growth since 1992, possibly due to growth in participation in tertiary education and training. Conversely, employment rates for people aged 45-64 have grown strongly since 1992, influenced by the phasing in of the higher age of eligibility for New Zealand Superannuation.
The women's employment rate is significantly lower than that of men, owing mainly to women's greater role in childcare responsibilities. The gap has, however, narrowed somewhat since the mid-1980s. This is the result of a long-term trend of increasing female labour force participation combined with a decline in male employment rates.
REGIONAL DIFFERENCES
Regional variations in employment rates show a different pattern from unemployment rates. The urban areas of Wellington (65.4 per cent), Waikato (63.1 per cent), Auckland (62.0 per cent) and Canterbury (62.1 per cent) have the highest employment levels, along with the Tasman-Nelson-Marlborough-West Coast region (63.0 per cent). Northland (55.9 per cent) and Manawatu-Whanganui (56.2 per cent) have the lowest rates, driven partly by high unemployment and (in the case of Manawatu) likely to be influenced by the high proportion of tertiary students.
INTERNATIONAL COMPARISONS
In 2000, New Zealand had the tenth highest employment rate (for people aged 15 and over) out of 29 OECD countries. The New Zealand rate was behind that of the UK, United States and most of the Scandinavian countries. Differences in female labour force participation rates are a key factor in international variation in employment rates.
Workplace injury claims
DEFINITION
The number of workplace accident insurance claims reported to the Accident Insurance Regulator per 1,000 full-time equivalent employees.
RELEVANCE
Safety at work is an important contributor to well-being and the risk of work-related accidents or illness can be seen as one component of the quality of work. The best currently available measure of the incidence of workplace injuries comes from the Accident Insurance Regulator's database of claims reported to it.
CURRENT LEVEL
As at September 2000, 217,000 work-related claims had been reported to the Accident Insurance Regulator for injuries incurred during the year to June 2000. This represents a rate of 140 claims per 1,000 full-time equivalent employees. The majority of claims were for medical treatment only (i.e. not including weekly compensation). Eighty-two per cent of claims were in respect of employees, the remainder being for self-employed (including employers). Prior to 1999/2000 data was collected by the Accident Compensation Corporation (ACC) on a different basis from that now used by the Accident Insurance Regulator. The number of claims reported to the ACC was approximately constant between 1994/95 and 1996/97 and then fell (from 281,000 to 243,000) up to 1998/99. Total claims reported to the Regulator in 1999/2000 were 10 per cent lower than the number reported to ACC in the previous year, but it is difficult to conclude much from this difference because of the different collection methods used. The number of claims for weekly compensation was similar for the two years.
The 1999/2000 accident claims include 59 work-related fatalities. It is likely that this is a slight underestimate of the actual number of fatalities, because of time lags in lodging claims and because in some circumstances there may be no claim made in relation to a fatal accident. Agriculture, forestry and fishing accounted for one quarter of fatal claims, and construction and transport for one fifth each.
AGE AND GENDER DIFFERENCES
Males are more than twice as likely as females to have workplace accidents involving an accident insurance claim (181 per 1,000 full-time equivalents (FTEs) for males compared with 84 per 1,000 FTEs for females). Among males, accident claim rates are highest for the 15-24 and 25-34 year age groups. Rates then decline with age, except for a higher rate among men aged 64 and over. Among women, there is no clear pattern across the age groups.
ETHNIC DIFFERENCES
Workplace accident claim rates are higher for Māori (164 per 1,000 FTEs) than for other ethnic groups. This is likely to reflect the fact that Māori are disproportionately employed in industries, such as forestry, and occupations that have high accident rates. The next highest rate is that for Pacific peoples (122 per 1,000 FTEs). The "Other" ethnic group has the lowest accident claim rate (101 per 1,000 FTEs). The rate for Europeans/Pākehā is 116 per 1,000 FTEs.

INDUSTRY DIFFERENCES
Variation in accident rates for different industries underlies many of the differences in accident rates for males and females, and ethnic and age groups. The highest accident rates are in Forestry (315 per 1,000 FTEs), Construction (230 per 1,000 FTEs) and Manufacturing (212 per 1,000 FTEs) industries.
