Knowledge and Skills
Desired Outcomes
All people have the knowledge and skills they need to participate fully in society. Lifelong learning and education are valued and supported. All people have the necessary skills to participate in a knowledge society.
Introduction
Knowledge and skills enhance people's ability to meet their basic needs, widen the range of options open to them in every sphere of life, and empower them to influence the direction their lives take. The skills people possess can also enhance people's sense of self-worth, security and belonging.
We now live in a 'knowledge society', one where access to information and proficiency with technology are no longer just helpful but essential for people to play a full role. All people need access to knowledge if we are to have an inclusive society.
Knowledge and skills include not only education and training, but also abilities gained though work and daily life: for example, parenting skills or skills relevant to recreation activities.
People also build their social networks around shared interests - ranging from the creative arts to sport - in which participation requires knowledge and skills. Knowledge of their own and others' cultures and history plays a crucial role in developing people's sense of identity.
Knowledge and skills relate directly to employment decisions and career choices. Those with relatively few educational qualifications are more likely to be unemployed and, on average, have lower incomes when in work. This affects not only the economic standard of living people are able to enjoy, but also their security and ability to make choices about their lives. Knowledge and skills are important for gaining access to services and for understanding and exercising civil and political rights.
Indicators
Five indicators are used in this chapter. Each provides a snapshot of New Zealanders' acquisition of knowledge and skills at a particular stage in their lives, from early childhood to school leaving age to adulthood. The indicators are: participation in early childhood education; the number of school leavers with higher qualifications; the overall educational attainment of the adult population; adult literacy in English; and participation in tertiary education.
All of these indicators are commonly used internationally19. Together, they provide a broad picture of New Zealanders' overall acquisition of knowledge and skills and, in turn, their ability to use their knowledge and skills to participate in society.
The focus of four of the five indicators is on formal education and training. This reflects the importance of formal education and training and the availability of data. However, a consequence of this is that as the qualifications framework for New Zealand changes - such as through the introduction of the National Certificate of Educational Achievement - the indicators used here will also have to change.
The indicators are relevant to both current and future social wellbeing. Childhood and teen educational participation and attainment, for example, are important as indicators of the potential knowledge and skill levels of future adults.
Participation in early childhood education is significant because early childhood is vital to a child's later development. Going to kindergarten, kohanga reo or some other pre-school institution prepares children for further learning and helps equip them to cope socially at school. Quality early childhood programmes can help narrow the achievement gap between children from low-income families and more advantaged children.20
Students who attain higher qualifications (Sixth Form Certificate or higher) at school have a wider range of options for higher education and future employment. Those who leave school early are at greater risk of unemployment or having low incomes.21
Educational attainment of the adult population provides a broad picture of New Zealanders' overall attainment of knowledge and skills. It is influenced by factors not measured in the other indicators, such as adults gaining new qualifications and new migrants arriving with qualifications.
Literacy is a fundamental skill. A good level of literacy in English, including numeracy and the ability to understand documents and tables, is vital in the workplace and in everyday life.
Participation in tertiary education opens up career opportunities and provides people with the skills they need to participate in society. This has become particularly important with the economy's increasing dependence on so-called 'knowledge' industries that require well-educated, highly-skilled workforces. It also captures aspects of lifelong learning through the participation of adults in tertiary education.
Participation in early childhood education
Definition: The number of enrolments of children aged three and four years in early childhood centres or home-based education programmes as a proportion of all three and four year olds. The measure includes all forms of organised and sustained centre and home-based programmes designed to foster learning and emotional and social development in children. The measure overestimates participation because children enrolled in more than one early childhood centre will be double-counted.
Relevance: Evidence from New Zealand and international research shows that the early years of childhood are vital to a child's development and future ability to learn22. Quality early childhood programmes prepare young children socially and academically for entry into primary education and can help narrow the achievement gap separating children from low-income families from more advantaged children.
Current Level and Trends
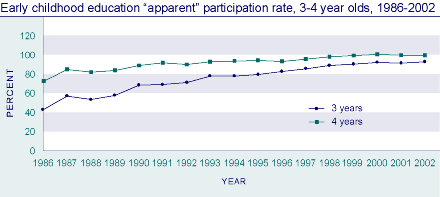
As at 1 July 2002, the 'apparent' early childhood education participation rate for three year olds was 93 percent and for four year olds it was 99 percent. This was an increase from 43 percent and 73 percent respectively in 1986. Much of the growth in participation in early childhood education occurred in the five years between 1986 and 1991 with slower growth in subsequent years.
Figure K1.1
Source: Ministry of
Education, Ministry of Social Development
Note: These figures overestimate the true participation rate. Rates in
excess of 100 percent are possible, because children can be enrolled in
more than one service
A new measure of early childhood education participation, which avoids the problem of double counting, comes from information collected when children are in Year One at school. This shows that, as at July 2001, 88 percent of all Year One students had attended some form of early childhood education service before starting school. This compares with 86 percent of Year One students in 2000.
Ethnic Differences
There are marked ethnic differences in the proportion of Year One students who had attended an early childhood education service, with European students being the most likely to have attended: 94 percent compared with 82 percent of Māori and 73 percent of Pacific Year One students in 2001.
Table K1.1 Early childhood education attendance (%) by Year One students by ethnic group, 1 July 2001
| European | Māori | Pacific | Asian | Other | Total | |
|---|---|---|---|---|---|---|
| 2000 | 92 | 79 | 69 | 83 | 75 | 86 |
| 2001 | 94 | 82 | 73 | 85 | 78 | 88 |
Source: Ministry of Education |
||||||
Participation by Type of Early Childhood Education Service
The 'apparent' early childhood participation rate shows that kindergartens are still the most widely used form of early childhood education service for three to four year olds, accounting for around 41 percent of all enrolments in 2001. Childcare centres cater for another large group (38 percent), with much smaller proportions in playcentres (6 percent) and kōhanga reo (5 percent). Among children under three years attending early childhood education programmes, childcare services account for half of all enrolments (51 percent), with playgroups (17 percent) and playcentres (13 percent) the next most widely used.
International Comparison
Compared with other countries, participation in early childhood education is high in New Zealand . In 2000, New Zealand ranked sixth out of 29 OECD countries in the proportion of under five year olds enrolled in early childhood education programmes, behind Iceland, Belgium, France, Spain and Italy.23
School leavers with higher qualifications
Definition: The proportion of secondary school leavers who leave school with Sixth Form Certificate in at least one subject, or with a higher qualification.
Relevance: Upper secondary education serves as the foundation for higher (post-secondary) learning and training opportunities as well as preparation for direct entry into the labour market. Those who leave school early with few qualifications are at a much greater risk of unemployment or vulnerability in the labour force and of having low incomes. 24
Current Level and Trends
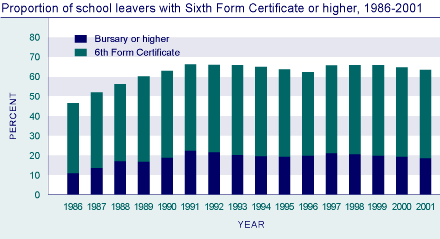
In 2001, 64 percent of school leavers (34,000) left school with at least Sixth Form Certificate. This proportion has increased considerably from 47 percent in 1986. However, most of the increase occurred in the late 1980s. Since 1991, the proportion has fluctuated between 63 percent and 66 percent.
The proportion of school leavers attaining an A or B Bursary or Scholarship also increased during the period 1986 to 1991 and has remained around 18-22 percent over the past decade. In 2001, 18 percent of school leavers (9,850) had attained an A or B Bursary.
The lack of growth in the proportion of school leavers with higher qualifications since the early 1990s may be partly explained by an increase in employment and training opportunities for those without higher qualifications. Trends in the proportion of school leavers with higher qualifications are influenced by changes in policy - such as the school leaving age - as well as student achievement.
Figure K2.1
Source: Ministry of
Education
Note: Bursary or higher includes A or B Bursary, Scholarship (to 1989)
and National Certificate Level 3 or above (from 1996)
Sex Differences
In 2001, 68 percent of female school leavers had Sixth Form Certificate or higher qualifications compared to 59 percent of males. Since 1986, the proportion of school leavers with at least Sixth Form Certificate has improved at a faster rate for females than for males.
Table K2.1 Proportion (%) of school leavers with higher qualifications, by sex, selected years, 1986-2001
| Sixth Form Certificate. or higher | Bursary or higher | |||
|---|---|---|---|---|
| Male | Female | Male | Female | |
| 1986 | 45.2 | 48.1 | 11.6 | 10.0 |
| 1991 | 63.5 | 69.2 | 21.1 | 23.4 |
| 1996 | 59.0 | 66.5 | 17.8 | 22.0 |
| 2001 | 59.4 | 68.1 | 15.8 | 21.2 |
Source: Ministry of Education |
||||
Ethnic Differences
Māori lag considerably behind other ethnic groups in the qualifications they attain at school. In 2001, 41 percent of Māori school leavers and 55 percent of Pacific school leavers attained Sixth Form Certificate or a higher qualification. This compares with 69 percent of European students and 85 percent of Asian students.
There is also a substantial difference between ethnic groups in the proportions leaving school with Bursary or similar higher qualifications. In 2001, 4.0 percent of Māori and 4.7 percent of Pacific school leavers gained an A or B Bursary or National Certificate at Level 3 or above, compared with 21 percent of European and 42 percent of Asian school leavers. There has been little change in these proportions over the decade to 2001.
Table K2.2 Proportion (%) of school leavers with higher qualifications by ethnic group, 1991, 1996, 2001
| European | Māori | Pacific peoples |
Asian | Other | Total | |
|---|---|---|---|---|---|---|
| Sixth Form Certificate or higher | ||||||
| 1991 | na | 37.4 | 52.2 | na | na | 66.3 |
| 1996 | 68.9 | 37.4 | 53.7 | 81.5 | 60.0 | 62.7 |
| 2001 | 68.5 | 40.6 | 54.7 | 84.7 | 63.7 | 63.6 |
| Bursary or Higher | ||||||
| 1991 | na | 5.1 | 7.4 | na | na | 22.3 |
| 1996 | 23.7 | 4.1 | 5.8 | 41.7 | 18.8 | 19.9 |
| 2001 | 21.2 | 4.0 | 4.7 | 42.2 | 20.5 | 18.4 |
Source: Ministry of Education |
||||||
Socio-economic differences
On average, young people from schools that draw their students from low socio-economic communities are less likely than other young people to attain higher school qualifications. In 2001, only 47 percent of school leavers from deciles 1-3 schools (in the most disadvantaged communities) attained Sixth Form Certificate or higher qualifications, compared to 60 percent of those leaving deciles 4-7 schools and 79 percent of those leaving deciles 8-10 schools.
Educational attainment of the adult population
Definition: The proportion of adults aged 25-64 years with educational attainment of at least upper secondary school level.
Relevance: The educational attainment of the adult population is an important indicator of the skills available in the economy. The level of formal educational qualifications in the population is a commonly used proxy for the stock of 'human capital', ie the skills available in the population and labour force.
Current Level and Trends
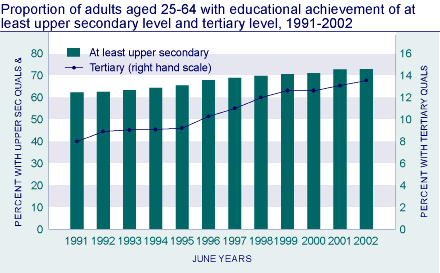
At June 2002, 73.0 percent of the population aged 25-64 years (1.4 million people) had attained an educational qualification of upper secondary level or above. This proportion has steadily increased from 62.3 percent in 1991. Over the same period the proportion of adults with a bachelor's degree or higher qualification has risen from 8.0 percent to 13.7 percent (270,000). While some of the increase is due to adults gaining additional qualifications, most of the upward trend is due to new entrants to the 25-64 age group (young people and migrants) being better qualified on average than people reaching retirement age.
Figure K3.1
Source: Statistics New
Zealand, Household Labour Force Survey
Note: Tertiary = Bachelor's degree or higher
Age and Sex Differences
Younger adults aged 25-34 years are much more likely to have at least upper secondary school qualifications than adults aged 55-64 (78.7 percent, compared to 58.4 percent). Similarly, young adults are more likely than older people to have tertiary qualifications (16.4 percent, compared to 7.6 percent).
Sex differences in educational attainment have narrowed over time. At ages 25-34, the proportions of men and women with higher qualifications are similar. In contrast, at older ages men are much more likely than women to have higher educational qualifications.
Table K3.1 Proportion (%) of population aged 25-64 with higher qualifications, by age and sex, 2002
| 25-34 | 35-44 | 45-54 | 55-64 | Total 25-64 | |
|---|---|---|---|---|---|
| At least upper secondary | |||||
| Males | 78.5 | 77.8 | 75.0 | 63.7 | 74.7 |
| Females | 78.9 | 76.2 | 69.9 | 53.2 | 71.3 |
| Total | 78.7 | 77.0 | 72.5 | 58.4 | 73.0 |
| Tertiary | |||||
| Males | 16.2 | 15.7 | 16.5 | 10.2 | 15.1 |
| Females | 16.7 | 13.1 | 12.3 | 5.1 | 12.5 |
| Total | 16.4 | 14.4 | 14.4 | 7.6 | 13.7 |
Source: Statistics New
Zealand, Household Labour Force Survey |
|||||
Ethnic Differences
Māori and Pacific adults are much less likely than European and Other ethnic groups to have higher qualifications. In the year ended June 2002, 60 percent of Māori and 50 percent of Pacific adults aged 25-64 held upper secondary qualifications, compared to 77 percent of Europeans. Similarly, just six percent of Māori and Pacific adults held a tertiary qualification at bachelor's degree level or above, compared to 14 percent of Europeans. However, since 1991, growth in the proportion of adults with higher qualifications was fastest among Māori and Pacific adults.
The growth in the proportion of Pacific peoples with higher qualifications reflects the increasing proportion of the Pacific population who are born and educated in New Zealand . The relatively high percentage of the 'Other' ethnic group with higher qualifications reflects the selective process of immigration, which tends to target those with higher qualifications.
Table K3.2 Proportion (%) of population aged 25-64 with higher qualifications, by ethnic group, selected years, 1991-2002
| European | Māori | Pacific peoples |
Other | Total | |
|---|---|---|---|---|---|
| At least upper secondary | |||||
| 1991 | 66.1 | 39.3 | 27.9 | 57.7 | 62.3 |
| 1996 | 72.2 | 47.4 | 38.1 | 59.9 | 68.0 |
| 2002 | 76.9 | 59.6 | 49.8 | 67.5 | 73.0 |
| Tertiary | |||||
| 1991 | 8.4 | 1.3 | .s | 19.7 | 8.0 |
| 1996 | 10.4 | 2.3 | 2.2 | 27.1 | 10.2 |
| 2002 | 13.5 | 5.5 | 5.8 | 31.5 | 13.7 |
Source: Statistics New
Zealand, Household Labour Force Survey |
|||||
International Comparison
In 2001, New Zealand ranked 11th among 30 OECD countries in the proportion of adults aged 25-64 years with at least upper secondary level qualifications, and 14th (equal with Ireland) in the proportion who have completed tertiary qualifications to bachelor's degree or higher. Countries which had higher proportions of adults with tertiary qualifications at this level included the United States (28 percent), Canada (20 percent), Australia (19 percent), and the United Kingdom (18 percent). Among younger adults aged 25-34 with a tertiary qualification, New Zealand ranked 15th, while Ireland ranked 11th.25
Adult literacy skills in English
Definition: The proportion of the population aged 16-65 with higher literacy skills in English (defined as prose, document and quantitative skills at Level 3 or above), as measured in the 1996 International Adult Literacy Survey (IALS).26
Relevance: The increasing complexity of our society and the need for a more flexible and highly educated workforce mean that individuals need to be able to understand and apply information of varying difficulty from a range of sources to function effectively at work and in everyday life. The IALS was designed to measure adult literacy skills in English by assessing proficiency levels, using test materials derived from specific contexts within countries. IALS Level 3 is the level considered the minimum required for individuals to meet the complex demands of everyday life and work in the emerging knowledge society.
Current Level
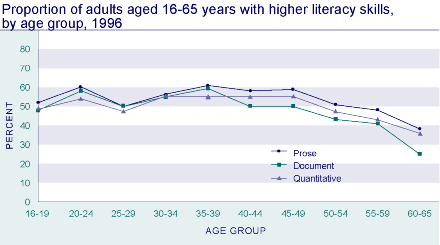
Results from the first international literacy survey in 1996 show that 54 percent of New Zealand's population aged 16-65 had higher level prose literacy skills (Level 3 or above); 51 percent had higher level document skills, and 50 percent had higher level quantitative skills.
Figure K4.1
Source: Walker et al 1997
Age Differences
Across all three domains the proportion of people with higher level literacy skills was broadly similar for people aged 16-49 but then declined with age for people aged over 50. Poorer literacy levels among those aged over 50 may be due either to differences in the education received by older people or to a decline in these skills over time.
Sex Differences
Women performed better than men in prose literacy (58 percent at Level 3 or above compared with 50 percent for men). The reverse was true in respect of quantitative skills: 55 percent of men had higher level quantitative literacy skills compared with 47 percent of women. Differences between men and women in respect of higher level document literacy skills were negligible.
Ethnic Differences
Europeans consistently had the largest proportions with higher levels of literacy across all three domains, with a clear majority having skills at Level 3 or above. Pacific peoples consistently had the smallest proportions at this level (less than a third in each domain). Māori had a larger proportion than other non-European ethnic groups in the higher levels of prose literacy but a smaller proportion in the document and quantitative literacy domains.
Table K4.1 Proportion (%) of adults aged 16-65 years with higher level literacy skills (Level 3 or above), 1996
| Prose literacy |
Document literacy |
Quantitative literacy |
|
|---|---|---|---|
| European | 61 | 56 | 57 |
| Māori | 36 | 30 | 30 |
| Pacific peoples |
27 | 25 | 28 |
| Other | 32 | 34 | 37 |
| Total | 54 | 51 | 50 |
Source: Walker et al 1997 |
|||
Among Māori and Pacific adults, there were considerable sex differences favouring males in the document and quantitative domains that were not evident among Europeans. For example, only 18 percent of Pacific females were at the higher levels of quantitative literacy compared with 42 percent of Pacific males. The sex disparity was not as great among Māori but was still substantial, with 26 percent of females at the higher levels of quantitative literacy compared with 36 percent of males.27
International Comparison
Of the 13 countries surveyed so far, only two had average prose literacy scores significantly higher than New Zealand's. Five had significantly higher average document literacy scores and eight had significantly higher average quantitative literacy scores.
Participation in tertiary education
Definition: The proportion of the population aged 15 and over enrolled on 31 July 2002 in formal tertiary education leading to a recognised New Zealand qualification. Tertiary education providers include public institutions (universities, polytechnics, colleges of education, wananga), and private tertiary education providers receiving government funding or approval, or registered with the New Zealand Qualifications Authority.
Relevance: Participation in tertiary education provides individuals with skills and knowledge that allow them to participate in society and the economy.
Current Level and Trends
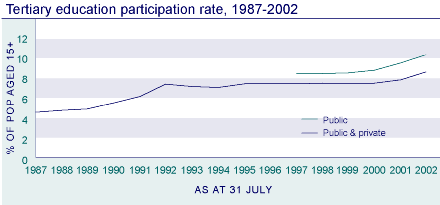
In July 2002, 10.5 percent of the population aged 15 and over (319,866 people) were enrolled in formal tertiary education (public and private), an increase from 8.5 percent (246,601 people) in 1997.
Long-term trend data is only available for public tertiary education institutions. In the mid-1980s, around five percent of the population aged 15 and over were enrolled in public tertiary education. The participation rate increased to over seven percent in the early 1990s, then remained relatively stable for several years before rising again from 2000, reaching 8.7 percent in 2002. Enrolments in private training establishments rose faster than enrolments in public institutions between 1999 and 2001. This pattern was reversed in 2002 as a result of a moratorium imposed by the government in July 2001 that limited access by private tertiary establishments to government funding.
FIGURE K5.1
Source: Ministry of Education;
Statistics New Zealand revised (2001-based) population estimates
Age and Sex Differences
Tertiary participation is highest among 18-24 year olds. In July 2002, the tertiary participation rate of 18-24 year olds was 36.4 percent, an increase from 30.7 percent in 1997. At the same time, 8.2 percent of 15-17 year olds were enrolled in formal tertiary education, along with 6.5 percent of adults aged 25 and over.
The recent growth in tertiary participation was strongest among females aged 18-24 years. Women are increasingly more likely than men to participate in tertiary study at ages 18 and over. The difference is greatest in the high incidence age group of 18-24 years, where the sex gap doubled from three to six percentage points between 1997 and 2002.
Table K5.1 Tertiary participation rates (%) by age and sex, 1997, 2001, 2002
| 15-17 | 18-24 | 25+ | Total | |
|---|---|---|---|---|
| Males | ||||
| 1997 | 7.4 | 29.2 | 4.2 | 7.8 |
| 2001 | 9.1 | 32.7 | 4.7 | 8.5 |
| 2002 | 8.0 | 33.3 | 5.0 | 9.0 |
| Females | ||||
| 1997 | 7.0 | 32.3 | 5.6 | 9.1 |
| 2001 | 8.7 | 37.3 | 6.9 | 10.6 |
| 2002 | 8.4 | 39.5 | 7.9 | 11.8 |
| Total | ||||
| 1997 | 7.2 | 30.7 | 5.0 | 8.5 |
| 2001 | 8.7 | 33.7 | 5.9 | 9.6 |
| 2002 | 8.2 | 36.4 | 6.5 | 10.5 |
Source: Ministry of Education, Statistics New Zealand 2001-based population estimates |
||||
Ethnic Differences
Māori participation in tertiary education has increased sharply in recent years. In July 2002, 16.8 percent of Māori aged 15 and over were enrolled in formal tertiary education, a jump from 11.1 percent in 2000 and 9.9 percent in 1997.
Much of this growth in Māori tertiary participation can be attributed to increasing enrolments at wānanga and private tertiary establishments. In July 2002, there were 36,300 Māori students enrolled at wānanga and private tertiary establishments, an increase of 42 percent over the number enrolled in 2001. Over the same period Māori enrolments in universities, polytechnics, and colleges of education increased by five percent, a smaller but still significant increase. Wānanga students accounted for 36 percent of Māori tertiary students in July 2002, compared to just seven percent in 2000.
Māori participation in tertiary education is higher than non-Māori participation among those under 18 and over 25, but considerably lower than non-Māori participation at the core tertiary education ages of 18-24 years.
Table K5.2 Tertiary participation rates (%) by age and ethnic group Māori, non-Māori, 2002
| Māori % | Non-Māori % | Total % | |
|---|---|---|---|
| 15-17 | 10.6 | 7.5 | 8.2 |
| 18-24 | 16.5 | 38.6 | 36.4 |
| 25+ | 14.7 | 5.5 | 6.5 |
| Total | 16.8 | 9.6 | 10.5 |
Source: Ministry of Education, Statistics New Zealand (2001-based) population estimates |
|||
The number of international tertiary students has also risen in recent years. In July 2002, there were 26,878 international students enrolled in formal tertiary institutions, more than double the number enrolled in 2000 (11,638). They made up eight percent of all tertiary students in 2002, up from four percent in 2000. A sharp rise in the number of students from China accounts for most of this increase.
