Housing affordability
Definition
The proportion of households and the proportion of people within households spending more than 30 percent of their income on housing.
Relevance
Affordable housing is an important factor in people’s wellbeing. For lower-income households especially, high housing costs relative to income are often associated with severe financial difficulty, and can leave households with insufficient income to meet other basic needs such as food, clothing, transport, medical care and education. High outgoings-to-income ratios are not as critical for higher-income households, as there is still sufficient income left for basic needs.
Current level and trends
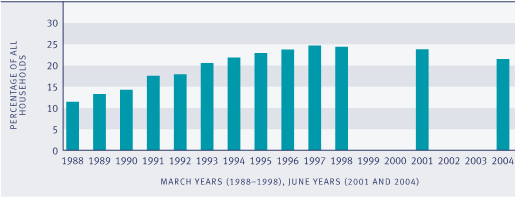
In 2004, 22 percent of New Zealand households spent more than 30 percent of their income on housing costs, a decline from 24 percent in 2001.
Since the late-1980s, there has been a substantial increase in the proportion of households spending more than 30 percent of their income on housing. Between 1988 and 1997, the proportion rose from 11 percent to 25 percent of households, before levelling off.
Figure EC5.1 Proportion of households with housing cost outgoings-to-income ratio greater than 30 percent, 1988–1998, 2001 and 2004

Source: Derived from Statistics New Zealand's Household Economic Survey (1988–2004), by the Ministry of Social Development
High housing costs relative to household income are of more concern in respect of low-income households. The proportion of households in the lowest 20 percent of the equivalised household income distribution spending more than 30 percent of their income on housing rose from 16 percent in 1988 to reach a peak of 49 percent in 1994 before levelling off at 41–42 percent over the period 1996–2001. In 2004, this proportion had fallen to 35 percent.58 While this represents a substantial improvement, the proportion of low-income households spending more than 30 percent of their income on housing is still over twice as high as it was in 1988.
Age and sex differences
In 2004, 29 percent of children under 18 years lived in households with housing costs exceeding 30 percent of income. This was a considerable decline from 35 percent in 2001 but is still more than double the proportion in 1988.
Adult females were as likely as adult males (20 percent) to be living in households spending more than 30 percent of their income on housing in 2004.
Table EC5.1 Proportion (%) of the population in households with housing cost outgoings-to-income ratio greater than 30 percent, selected years, 1988–2004
| |
1987–1988 |
1992–1993 |
1997–1998 |
2000–2001 |
2003–2004 |
| Total population |
10.6 |
20.6 |
24.9 |
23.6 |
21.4 |
| Population aged 15 and over |
9.9 |
19.0 |
21.9 |
20.9 |
19.7 |
| Males aged 15 and over |
10.3 |
18.8 |
21.0 |
19.9 |
20.0 |
| Females aged 15 and over |
9.5 |
19.3 |
22.7 |
21.9 |
19.5 |
| Age groups |
|
|
|
|
|
| Under 18 years |
11.9 |
27.1 |
37.1 |
34.2 |
29.2 |
| 18–24 years |
12.4 |
24.6 |
26.1 |
28.6 |
29.0 |
| 25–44 years |
14.7 |
26.3 |
31.1 |
28.0 |
25.0 |
| 45–64 years |
5.0 |
12.2 |
13.8 |
15.5 |
15.4 |
| 65 years and over |
3.2 |
4.0 |
7.1 |
7.1 |
5.9 |
Source: Derived from Statistics New Zealand's Household Economic Survey (1988–2004), by the Ministry of Social Development
Ethnic differences
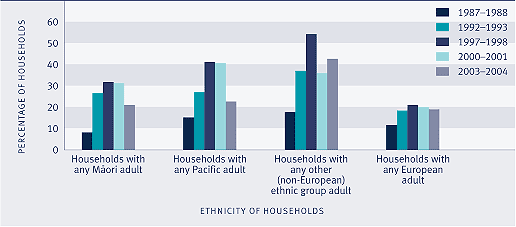
Housing costs in excess of 30 percent of income are more common in households that include at least one non-European adult. For households with at least one Māori adult, the proportion increased from 8 percent in 1988 to peak at 36 percent in 1997, fell slightly to 31 percent in 2001, then dropped sharply to 21 percent in 2004. For those households with at least one Pacific adult, the changes have been more dramatic, the proportion increasing from 15 percent in 1988 to 48 percent in 1997, falling to 41 percent in 1998 and 2001, then almost halving to 23 percent in 2004. Only non-European households other than Māori and Pacific households showed an increase in the proportion with housing costs greater than 30 percent between 2001 and 2004, from 36 percent to 42 percent. This may reflect, in part, the changing composition of a group that has many new migrants.
Figure EC5.2 Proportion of households with housing cost outgoings-to-income ratio greater than 30 percent, by ethnic group, selected years, 1988–2004

Source: Derived from Statistics New Zealand's Household Economic Survey (1988–2004), by the Ministry of Social Development
|


