Educational attainment of the adult population
Definition
The proportion of adults aged 25–64 years with an educational attainment of at least upper secondary school level.
Relevance
The educational attainment of the adult population is an indicator of the skills available in the economy. The level of formal educational qualifications in the population is a commonly used proxy for the stock of "human capital", ie the skills available in the population and labour force.
Current level and trends
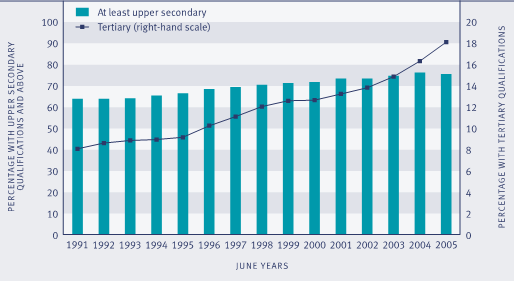
In the year ended June 2005, 76 percent of the population aged 25–64 years (1.6 million people) had attained an educational qualification at upper secondary level or above, the same proportion as in 2004 and an increase from 64 percent in 1991. Over the same period the proportion of adults with a bachelor’s degree or higher qualification had risen from 8 percent to 18 percent (382,000).
Figure K4.1 Proportion of adults aged 25–64 years with an educational attainment of at least upper secondary level and tertiary level, 1991–2005

Source: Statistics New Zealand, Household Labour Force Survey
Notes: (1) Tertiary equals bachelor’s degree or higher (2) Figures prior to 2005 have been revised
Age and sex differences
Younger adults aged 25–34 years are much more likely to have at least upper secondary school qualifications than adults aged 55–64 years (82 percent, compared to 63 percent). Similarly, young adults are more likely than older people to have a bachelor’s degree or higher (24 percent, compared to 10 percent).
Sex differences in educational attainment have narrowed over time. In 2005, women were more likely than men to have higher educational qualifications at ages 25–34. In contrast, at older ages men are much more likely than women to have higher educational qualifications.
Table K4.1 Proportion (%) of population aged 25–64 years with higher qualifications, by age and sex, 2005
| |
25–34 |
35–44 |
45–54 |
55–64 |
Total 25–64 |
| At least upper secondary |
|
|
|
|
|
| Males |
81.2 |
79.9 |
77.5 |
68.0 |
77.3 |
| Females |
82.4 |
77.9 |
72.1 |
58.3 |
73.9 |
| Total |
81.8 |
78.9 |
74.7 |
63.1 |
75.5 |
| Tertiary |
|
|
|
|
|
| Males |
22.4 |
20.6 |
18.5 |
12.4 |
18.9 |
| Females |
24.9 |
19.2 |
14.9 |
8.0 |
17.4 |
| Total |
23.7 |
19.8 |
16.7 |
10.1 |
18.1 |
Source: Statistics New Zealand, Household Labour Force Survey
Notes: (1) Tertiary equals bachelor’s degree or higher (2) Figures prior to 2005 have been revised
Ethnic differences
Māori and Pacific adults are much less likely than adults in the European and Other ethnic groups to have higher qualifications. In the year ended June 2005, 62 percent of Māori and 50 percent of Pacific adults aged 25–64 years held at least upper secondary qualifications, compared with 79 percent of Europeans. Similarly, just 7 percent of Māori and 6 percent of Pacific adults held a tertiary qualification at bachelor’s degree level or above, compared with 18 percent of Europeans. However, since 1991, growth in the proportion of adults with at least upper secondary qualifications was faster for Māori and Pacific adults than for Europeans. The Other ethnic group has consistently had the highest proportion of adults with a tertiary qualification, more than double that of Europeans.
Table K4.2 Proportion (%) of population aged 25–64 years with higher qualifications, by ethnic group, selected years, 1996–2005
| |
European |
Māori |
Pacific |
Other |
Total |
| At least upper secondary |
|
|
|
|
|
| 1996 |
72.8 |
48.1 |
38.5 |
60.2 |
68.6 |
| 2001 |
77.0 |
58.6 |
56.2 |
66.2 |
73.4 |
| 2004 |
79.2 |
64.7 |
61.2 |
71.2 |
76.1 |
| 2005 |
79.4 |
62.1 |
49.8 |
70.9 |
75.5 |
| Tertiary |
|
|
|
|
|
| 1996 |
10.4 |
2.4 |
2.1 |
27.2 |
10.2 |
| 2001 |
13.2 |
4.7 |
5.3 |
30.6 |
13.2 |
| 2004 |
15.8 |
6.1 |
7.2 |
37.3 |
16.3 |
| 2005 |
17.6 |
6.8 |
6.1 |
39.5 |
18.1 |
Source: Statistics New Zealand, Household Labour Force Survey
Notes: (1) Other in this data includes the Asian population (2) Tertiary equals bachelor’s degree or higher (3) Figures prior to 2005 have been revised
International comparison
In 2003, 78 percent of New Zealand adults had at least upper secondary level qualifications, compared with an OECD median of 66 percent.43 New Zealand ranked 11th out of 30 OECD countries. New Zealand ranked 14th equal (with Finland and Ireland) in the proportion of adults who have bachelor’s degrees or higher, with a rate of 16 percent (the same as the OECD median). Countries which had higher proportions of adults with qualifications at this level included the United States and Norway (each 29 percent – the highest rate), Canada (22 percent), Australia (20 percent), and the United Kingdom (19 percent). New Zealand is among the two-thirds of OECD countries in which females aged 25–34 are more likely than males of that age to have tertiary qualifications to bachelor’s degree or higher.
|

