Satisfaction with work-life balance
Definition
The proportion of employed people who are "satisfied" or "very satisfied" with their work-life balance, as reported in the Quality of Life in New Zealand's Largest Cities Survey 2004.
Relevance
It is important that people find a balance between paid work and other aspects of their lives. When this balance is not found, people may suffer from stress or anxiety. Long working hours or non-standard working hours (eg night shifts) may compromise work-life balance.
Current level
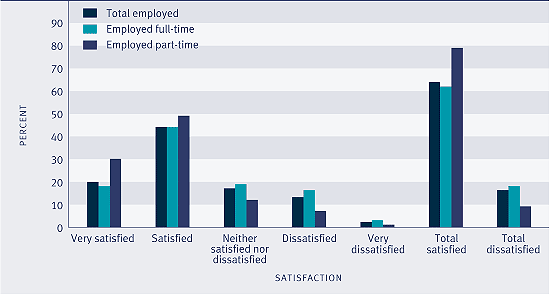
Results from the Quality of Life in New Zealand's Largest Cities Survey 2004 show most employed New Zealanders (66 percent) are "satisfied" or "very satisfied" with their work-life balance. People in part-time employment (79 percent) are more likely to be "satisfied" or "very satisfied" with their work-life balance than people in full-time employment (62 percent).
Figure PW5.1 Satisfaction with work-life balance, by employment status, 2004

Source: Auckland City Council et al (2005) Quality of Life in New Zealand's Largest Cities Survey 2004
Age differences
Those least likely to be satisfied with their work-life balance are people aged 15–24 years (65 percent) and those aged 25–49 years (64 percent).
Sex differences
Females (69 percent) are more likely to report being satisfied with their work-life balance than males (64 percent). This difference partly reflects the fact females are more likely than males to be in part-time work. Among full-time workers, males (63 percent) and females (62 percent) report similar levels of satisfaction with their work-life balance.
Ethnic differences
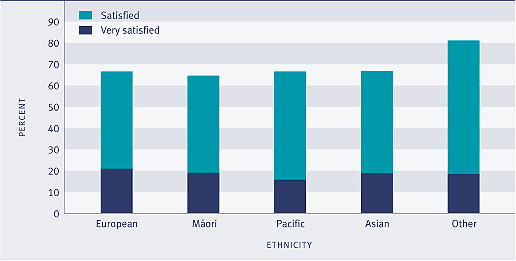
Those of the Other ethnic groups (excluding Asians) report the highest levels of satisfaction with work-life balance (81 percent). There is little difference between the remaining ethnic groups, with 66 percent of European, Pacific peoples and Asians and 64 percent of Māori reporting satisfaction with work-life balance.
Figure PW5.2 Satisfaction with work-life balance, by ethnicity, 2004

Source: Auckland City Council et al (2005) Quality of Life in New Zealand's Largest Cities Survey 2004
Socio-economic differences
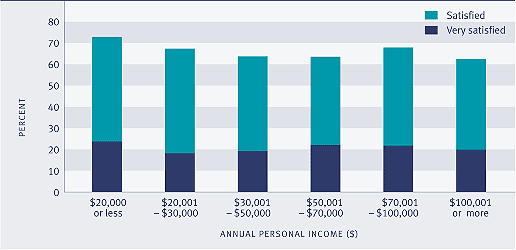
Employed New Zealanders whose personal incomes are $20,000 or less are the most likely to be satisfied overall with their balance of work and life (73 percent). This group includes many women who work part-time.
Figure PW5.3 Satisfaction with work-life balance, by personal income, 2004

Source: Auckland City Council et al (2005) Quality of Life in New Zealand's Largest Cities Survey 2004
Regional differences
Satisfaction with work-life balance varies across cities. Those people with the highest levels of satisfaction live in Wellington (70 percent). Auckland City and Hamilton recorded the lowest levels of satisfaction (62 percent).
|


