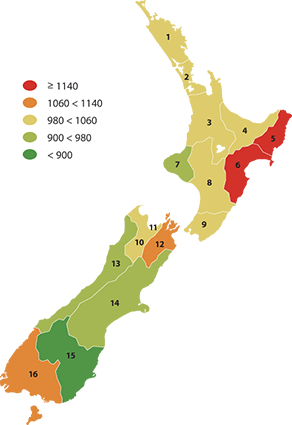
Recorded criminal offences
The total number of recorded criminal offences and the recorded
criminal offence rate per 10,000 population.
| Region |
Offences per 10,000 population |
| 1999 |
2000 |
2001 |
2002 |
2003 |
2004 |
2005 |
2006 |
2007 |
2008 |
| 1 |
Northland |
1,160 |
1,155 |
1,133 |
1,187 |
1,102 |
1,019 |
1,032 |
1,005 |
1,049 |
1,041 |
| 2 |
Auckland |
1,136 |
1,143 |
1,148 |
1,177 |
1,148 |
1,007 |
1,026 |
1,066 |
1,046 |
1,022 |
| 3 |
Waikato |
1,259 |
1,141 |
1,125 |
1,128 |
1,063 |
982 |
1,012 |
1,077 |
1,037 |
987 |
| 4 |
Bay of Plenty |
1,286 |
1,240 |
1,298 |
1,281 |
1,257 |
1,169 |
1,113 |
1,028 |
1,090 |
1,053 |
| 5 |
Gisborne |
1,219 |
1,259 |
1,250 |
1,360 |
1,289 |
1,230 |
1,237 |
1,268 |
1,253 |
1,285 |
| 6 |
Hawke's Bay |
1,253 |
1,279 |
1,245 |
1,293 |
1,239 |
1,123 |
1,144 |
1,232 |
1,218 |
1,187 |
| 7 |
Taranaki |
1,050 |
980 |
967 |
896 |
963 |
819 |
815 |
922 |
913 |
922 |
| 8 |
Manawatu-Whanganui |
1,273 |
1,170 |
1,095 |
1,092 |
1,035 |
910 |
937 |
977 |
968 |
985 |
| 9 |
Wellington |
1,008 |
993 |
998 |
989 |
1,037 |
945 |
904 |
945 |
948 |
1,025 |
| 10 |
Tasman |
991 |
999 |
946 |
1,007 |
939 |
992 |
919 |
1,077 |
929 |
991 |
| 11 |
Nelson |
| 12 |
Marlborough |
1,069 |
1,085 |
1,073 |
1,091 |
1,179 |
1,137 |
1,110 |
1,093 |
1,055 |
1,112 |
| 13 |
West Coast |
1,025 |
1,033 |
981 |
971 |
1,052 |
847 |
782 |
897 |
899 |
938 |
| 14 |
Canterbury |
1,072 |
1,001 |
998 |
991 |
997 |
937 |
854 |
878 |
884 |
938 |
| 15 |
Otago |
1,050 |
987 |
968 |
1,011 |
1,050 |
979 |
961 |
961 |
937 |
900 |
| 16 |
Southland |
1,332 |
1,217 |
1,097 |
1,193 |
1,211 |
997 |
1,069 |
1,033 |
1,054 |
1,113 |
|

