Participation in early childhood education
The number of 3 and 4 year olds enrolled in early childhood
education programmes and the number of Year 1 students who indicated
they have attended some form of early childhood education.
| Region |
"Apparent" participation rate (%) |
| 2001 |
2002 |
2003 |
2004 |
2005 |
2006 |
2007 |
2008 |
| 1 |
Northland |
74.8 |
78.7 |
78.3 |
83.4 |
86.5 |
85.7 |
84.6 |
84.9 |
| 2 |
Auckland |
81.4 |
82.4 |
82.7 |
82.4 |
82.8 |
83.2 |
82.0 |
85.8 |
| 3 |
Waikato |
83.6 |
86.0 |
88.3 |
89.2 |
92.9 |
91.7 |
92.5 |
93.4 |
| 4 |
Bay of Plenty |
91.8 |
91.8 |
90.9 |
93.6 |
98.0 |
97.5 |
97.6 |
103.0 |
| 5 |
Gisborne |
73.3 |
81.3 |
81.6 |
83.6 |
86.7 |
88.4 |
85.8 |
84.1 |
| 6 |
Hawke's Bay |
100.6 |
103.6 |
106.1 |
112.6 |
114.3 |
105.6 |
105.0 |
106.7 |
| 7 |
Taranaki |
87.5 |
88.4 |
93.7 |
98.5 |
101.4 |
101.1 |
96.4 |
102.7 |
| 8 |
Manawatu-Whanganui |
89.8 |
89.2 |
93.1 |
95.2 |
96.7 |
100.5 |
98.3 |
97.1 |
| 9 |
Wellington |
96.1 |
95.4 |
95.2 |
95.3 |
96.8 |
101.1 |
100.9 |
103.2 |
| 10 |
Tasman |
91.0 |
87.4 |
89.2 |
93.9 |
97.6 |
95.2 |
96.7 |
95.5 |
| 11 |
Nelson |
106.8 |
101.9 |
101.0 |
101.6 |
96.9 |
99.2 |
111.8 |
105.6 |
| 12 |
Marlborough |
98.5 |
96.4 |
99.3 |
100.4 |
97.5 |
98.0 |
100.6 |
98.3 |
| 13 |
West Coast |
79.3 |
81.2 |
84.0 |
89.6 |
86.0 |
85.9 |
88.4 |
90.7 |
| 14 |
Canterbury |
102.4 |
103.9 |
106.2 |
104.6 |
107.3 |
107.9 |
105.5 |
107.7 |
| 15 |
Otago |
105.9 |
106.7 |
108.0 |
110.9 |
108.3 |
105.9 |
107.3 |
105.5 |
| 16 |
Southland |
82.9 |
85.8 |
90.5 |
90.3 |
90.9 |
90.9 |
99.9 |
98.5 |
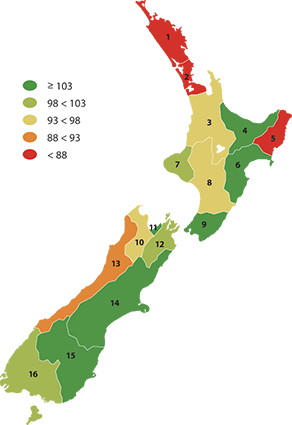
"Apparent" participation rate, 3 and 4 year olds, 2008 (numbers can
add to more than 100%)
| Region |
"Apparent"
participation rate (%) |
Number
enrolled |
| 3 year |
4 year |
3 year |
4 year |
| Northland |
83 |
87 |
1,800 |
1,897 |
| Auckland |
82 |
90 |
16,128 |
18,060 |
| Waikato |
89 |
98 |
5,128 |
5,519 |
| Bay of Plenty |
103 |
103 |
3,914 |
4,037 |
| Gisborne |
84 |
84 |
628 |
625 |
| Hawke's Bay |
103 |
110 |
2,213 |
2,397 |
| Taranaki |
101 |
105 |
1,438 |
1,457 |
| Manawatu-Whanganui |
94 |
101 |
2,830 |
3,003 |
| Wellington |
103 |
103 |
6,387 |
6,508 |
| Tasman |
94 |
97 |
567 |
661 |
| Nelson |
100 |
111 |
541 |
603 |
| Marlborough |
94 |
102 |
454 |
541 |
| West Coast |
81 |
101 |
310 |
392 |
| Canterbury |
104 |
111 |
7,060 |
7,649 |
| Otago |
106 |
105 |
2,460 |
2,330 |
| Southland |
89 |
109 |
1,170 |
1,332 |
Early childhood attendance by Year 1 students, by ethnicity, 2008
| Region |
European |
Māori |
Pacific |
Asian |
Other |
Total |
| Number |
% |
Number |
% |
Number |
% |
Number |
% |
Number |
% |
Number |
% |
| Northland |
892 |
95.7 |
909 |
86.7 |
25 |
89.3 |
42 |
93.3 |
21 |
100.0 |
1,889 |
91.0 |
| Auckland |
7,682 |
98.4 |
2,630 |
84.1 |
3,276 |
81.7 |
2,873 |
95.0 |
498 |
92.6 |
16,959 |
91.6 |
| Waikato |
2,906 |
97.8 |
1,673 |
89.6 |
151 |
88.8 |
264 |
95.0 |
95 |
91.3 |
5,089 |
94.4 |
| Bay of Plenty |
1,762 |
98.0 |
1,413 |
90.8 |
69 |
83.1 |
112 |
91.1 |
37 |
92.5 |
3,393 |
94.2 |
| Gisborne |
234 |
95.5 |
424 |
90.0 |
12 |
85.7 |
6 |
85.7 |
3 |
75.0 |
679 |
91.6 |
| Hawke's Bay |
1,069 |
98.9 |
727 |
93.8 |
115 |
92.7 |
47 |
94.0 |
16 |
100.0 |
1,974 |
96.5 |
| Taranaki |
911 |
97.5 |
341 |
95.3 |
33 |
97.1 |
36 |
97.3 |
21 |
95.5 |
1,342 |
96.9 |
| Manawatu-Whanganui |
1,647 |
98.2 |
906 |
95.6 |
109 |
98.2 |
96 |
99.0 |
35 |
97.2 |
2,793 |
97.4 |
| Wellington |
3,342 |
98.8 |
1,174 |
95.1 |
557 |
93.8 |
502 |
96.5 |
140 |
95.2 |
5,715 |
97.2 |
| Tasman |
492 |
98.6 |
57 |
95.0 |
4 |
80.0 |
11 |
100.0 |
7 |
100.0 |
571 |
98.1 |
| Nelson |
352 |
97.2 |
76 |
96.2 |
12 |
92.3 |
20 |
87.0 |
9 |
100.0 |
469 |
96.5 |
| Marlborough |
398 |
99.0 |
68 |
94.4 |
17 |
85.0 |
3 |
75.0 |
5 |
100.0 |
491 |
97.6 |
| West Coast |
276 |
94.8 |
48 |
92.3 |
2 |
66.7 |
1 |
100.0 |
8 |
88.9 |
335 |
94.1 |
| Canterbury |
4,881 |
99.2 |
799 |
98.2 |
210 |
94.2 |
294 |
96.1 |
125 |
96.2 |
6,309 |
98.7 |
| Otago |
1,682 |
98.9 |
241 |
96.8 |
61 |
100.0 |
86 |
100.0 |
19 |
95.0 |
2,089 |
98.7 |
| Southland |
922 |
97.7 |
211 |
95.0 |
30 |
93.8 |
11 |
100.0 |
12 |
100.0 |
1,186 |
97.1 |
|

