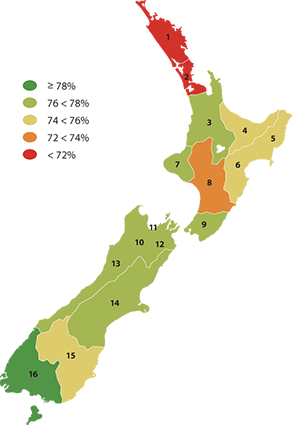
Employment rate (%)
The proportion of the population aged 15–64 years who are in paid
employment for at least one hour per week.

| Region |
Population 15–64 years in paid
employment (%) |
| 1986 |
1991 |
1996 |
2001 |
2002 |
2003 |
2004 |
2005 |
2006 |
2007 |
2008 |
| 1 |
Northland |
66.1 |
60.5 |
63.1 |
64.9 |
64.7 |
66.9 |
68.3 |
70.9 |
73.2 |
74.3 |
70.5 |
| 2 |
Auckland |
74.6 |
65.6 |
72.4 |
69.9 |
69.9 |
70.0 |
70.9 |
71.1 |
71.9 |
71.8 |
71.8 |
| 3 |
Waikato |
69.9 |
65.6 |
69.2 |
71.0 |
74.3 |
74.7 |
75.8 |
75.8 |
75.7 |
77.1 |
76.7 |
| 4 |
Bay of Plenty |
70.0 |
62.4 |
66.3 |
67.8 |
70.3 |
70.5 |
75.3 |
75.4 |
76.2 |
76.8 |
74.5 |
| 5 |
Gisborne |
70.6 |
59.9 |
67.5 |
69.5 |
71.8 |
71.9 |
71.4 |
73.5 |
75.0 |
76.0 |
74.4 |
| 6 |
Hawke's Bay |
| 7 |
Taranaki |
70.9 |
63.0 |
67.6 |
72.4 |
75.6 |
75.8 |
73.5 |
76.0 |
77.1 |
77.6 |
76.6 |
| 8 |
Manawatu-Whanganui |
70.7 |
62.1 |
66.4 |
68.4 |
70.2 |
70.2 |
70.4 |
73.1 |
73.3 |
71.7 |
73.2 |
| 9 |
Wellington |
76.0 |
68.9 |
72.8 |
75.1 |
74.2 |
73.4 |
73.0 |
74.4 |
75.3 |
77.3 |
76.7 |
| 10 |
Tasman |
70.6 |
68.7 |
72.5 |
75.7 |
76.2 |
75.9 |
76.5 |
77.9 |
77.9 |
77.9 |
77.3 |
| 11 |
Nelson |
| 12 |
Marlborough |
| 13 |
West Coast |
| 14 |
Canterbury |
72.0 |
66.2 |
72.6 |
74.8 |
75.5 |
75.9 |
77.6 |
79.0 |
78.7 |
78.0 |
77.3 |
| 15 |
Otago |
70.3 |
64.9 |
69.6 |
71.7 |
71.8 |
70.9 |
72.6 |
74.5 |
75.7 |
75.9 |
75.8 |
| 16 |
Southland |
69.5 |
67.8 |
71.9 |
75.9 |
74.6 |
75.5 |
77.6 |
79.7 |
79.9 |
81.5 |
80.8 |
Employment rate, by age and sex, 2008 (%)
| Region |
15 - 24 |
25 - 44 |
45 - 64 |
65+ |
Male |
Female |
Total |
| 15-64 |
15-64 |
15-64 |
| Northland |
55.0 |
76.3 |
71.8 |
13.2 |
74.9 |
66.0 |
70.5 |
| Auckland |
51.6 |
79.5 |
75.7 |
18.6 |
78.5 |
65.3 |
71.8 |
| Waikato |
59.9 |
80.2 |
82.9 |
15.4 |
82.4 |
70.9 |
76.7 |
| Bay of Plenty |
54.9 |
78.9 |
80.1 |
11.8 |
81.4 |
67.8 |
74.5 |
| Gisborne |
52.9 |
78.5 |
81.1 |
14.1 |
79.6 |
69.7 |
74.4 |
| Hawke's Bay |
| Taranaki |
57.9 |
82.0 |
79.7 |
15.7 |
85.9 |
67.3 |
76.6 |
| Manawatu-Whanganui |
58.1 |
76.7 |
78.4 |
14.1 |
80.0 |
66.9 |
73.2 |
| Wellington |
55.2 |
83.7 |
80.6 |
16.0 |
82.0 |
71.8 |
76.7 |
| Tasman |
67.2 |
80.3 |
78.8 |
14.2 |
83.1 |
71.7 |
77.3 |
| Nelson |
| Marlborough |
| West Coast |
| Canterbury |
60.4 |
82.6 |
81.4 |
13.8 |
82.8 |
71.9 |
77.3 |
| Otago |
58.4 |
82.7 |
80.8 |
11.9 |
82.0 |
70.0 |
75.8 |
| Southland |
65.0 |
85.9 |
83.4 |
17.4 |
87.3 |
73.8 |
80.8 |
|