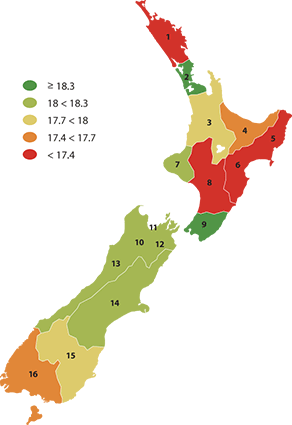
Median hourly earnings ($)
Real median hourly earnings from all wages and salaries for employees earning income from wage and salary jobs, as measured by the New Zealand Income Survey.

| Region |
Median hourly earnings ($) |
| 1998 |
1999 |
2000 |
2001 |
2002 |
2003 |
2004 |
2005 |
2006 |
2007 |
2008 |
| 1 |
Northland |
14.7 |
15.4 |
15.5 |
16.0 |
15.9 |
15.5 |
16.7 |
16.9 |
15.9 |
17.2 |
17.0 |
| 2 |
Auckland |
17.9 |
18.3 |
18.6 |
18.0 |
18.3 |
18.6 |
18.8 |
19.2 |
19.0 |
20.0 |
19.9 |
| 3 |
Waikato |
16.1 |
15.8 |
15.8 |
16.2 |
16.5 |
16.4 |
17.5 |
17.6 |
17.4 |
18.0 |
17.9 |
| 4 |
Bay of Plenty |
15.8 |
15.8 |
15.5 |
15.6 |
15.7 |
16.4 |
16.5 |
17.0 |
17.0 |
17.3 |
17.5 |
| 5 |
Gisborne |
15.8 |
15.5 |
15.8 |
16.0 |
16.0 |
16.2 |
16.5 |
16.5 |
16.8 |
16.7 |
17.3 |
| 6 |
Hawke's Bay |
| 7 |
Taranaki |
16.4 |
15.6 |
15.5 |
15.6 |
15.4 |
16.6 |
17.1 |
17.2 |
17.0 |
17.5 |
18.0 |
| 8 |
Manawatu-Whanganui |
14.8 |
15.2 |
15.3 |
15.6 |
15.3 |
15.6 |
16.5 |
17.2 |
15.9 |
16.8 |
17.0 |
| 9 |
Wellington |
18.6 |
19.4 |
18.6 |
18.6 |
19.2 |
18.9 |
19.4 |
18.0 |
19.9 |
20.9 |
20.1 |
| 10 |
Tasman |
15.1 |
15.2 |
15.5 |
15.5 |
15.3 |
15.6 |
16.2 |
16.5 |
17.0 |
17.6 |
18.0 |
| 11 |
Nelson |
| 12 |
Marlborough |
| 13 |
West Coast |
| 14 |
Canterbury |
15.8 |
16.4 |
16.3 |
16.1 |
16.3 |
16.4 |
17.1 |
17.8 |
17.7 |
18.3 |
18.2 |
| 15 |
Otago |
16.1 |
15.2 |
14.9 |
15.6 |
15.3 |
16.0 |
16.0 |
17.3 |
17.4 |
18.0 |
17.8 |
| 16 |
Southland |
16.9 |
15.2 |
16.5 |
15.9 |
16.5 |
15.5 |
16.4 |
16.5 |
17.7 |
17.4 |
17.6 |
|