Household crowding
The proportion of the population living in crowded housing (ie
requiring one or more additional bedrooms, as defined by the Canadian
Crowding Index).
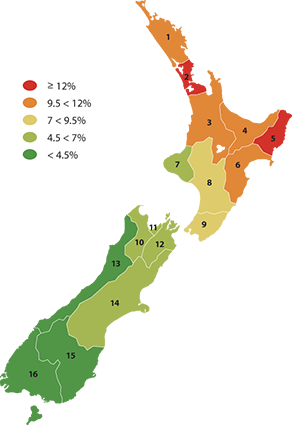
| Region |
Households with fewer bedrooms
than needed (%) |
| 1986 |
1991 |
1996 |
2001 |
2006 |
| 1 |
Northland |
15.9 |
14.5 |
13.2 |
11.6 |
11.9 |
| 2 |
Auckland |
16.4 |
15.7 |
15.8 |
15.3 |
15.7 |
| 3 |
Waikato |
12.9 |
11.8 |
10.5 |
9.4 |
9.6 |
| 4 |
Bay of Plenty |
15.5 |
13.3 |
12.2 |
10.4 |
10.4 |
| 5 |
Gisborne |
18.3 |
16.8 |
15.6 |
14.6 |
15.2 |
| 6 |
Hawke's Bay |
13.6 |
12.5 |
10.9 |
10.5 |
10.5 |
| 7 |
Taranaki |
10.1 |
8.8 |
6.9 |
5.8 |
6.1 |
| 8 |
Manawatu-Whanganui |
10.8 |
9.9 |
8.1 |
7.0 |
7.1 |
| 9 |
Wellington |
12.1 |
11.3 |
10.1 |
9.3 |
9.1 |
| 10 |
Tasman |
9.6 |
7.6 |
5.9 |
5.3 |
4.7 |
| 11 |
Nelson |
9.1 |
8.0 |
6.6 |
6.0 |
5.2 |
| 12 |
Marlborough |
8.2 |
8.0 |
6.1 |
5.1 |
5.4 |
| 13 |
West Coast |
9.9 |
7.6 |
6.0 |
4.2 |
4.2 |
| 14 |
Canterbury |
8.5 |
7.7 |
6.3 |
5.0 |
5.6 |
| 15 |
Otago |
8.0 |
6.9 |
5.3 |
4.2 |
4.3 |
| 16 |
Southland |
10.1 |
8.5 |
5.7 |
4.1 |
4.1 |
Household crowding, by ethnicity, 2006
| Region |
European |
Māori |
Pacific |
Asian |
Other |
Total |
| Number |
% |
Number |
% |
Number |
% |
Number |
% |
Number |
% |
Number |
% |
| Northland |
5,781 |
6.0 |
9,891 |
25.5 |
1,011 |
30.8 |
294 |
12.7 |
39 |
10.7 |
15,678 |
11.9 |
| Auckland |
38,223 |
5.2 |
33,723 |
26.9 |
78,012 |
47.8 |
47,508 |
21.5 |
4,140 |
23.3 |
190,017 |
15.7 |
| Waikato |
12,987 |
4.7 |
17,238 |
24.7 |
3,219 |
29.7 |
3,315 |
19.6 |
675 |
28.9 |
34,017 |
9.6 |
| Bay of Plenty |
8,091 |
4.5 |
15,681 |
25.5 |
1,731 |
29.8 |
1,224 |
17.2 |
81 |
10.4 |
24,594 |
10.4 |
| Gisborne |
1,530 |
6.5 |
4,518 |
25.7 |
351 |
29.8 |
99 |
15.0 |
9 |
10.3 |
6,099 |
15.2 |
| Hawke's Bay |
5,508 |
5.2 |
7,944 |
26.4 |
1,698 |
36.9 |
642 |
20.6 |
96 |
19.5 |
14,349 |
10.5 |
| Taranaki |
3,273 |
3.9 |
2,514 |
17.4 |
294 |
23.8 |
261 |
14.4 |
6 |
2.7 |
5,871 |
6.1 |
| Manawatu-Whanganui |
6,798 |
4.1 |
6,900 |
18.2 |
1,479 |
28.2 |
1,020 |
14.0 |
183 |
17.0 |
14,535 |
7.1 |
| Wellington |
14,118 |
4.4 |
9,996 |
19.7 |
11,340 |
35.6 |
5,232 |
15.4 |
1,434 |
28.0 |
38,424 |
9.1 |
| Tasman |
1,560 |
4.0 |
327 |
11.5 |
48 |
16.3 |
93 |
18.8 |
3 |
2.9 |
1,959 |
4.7 |
| Nelson |
1,350 |
3.8 |
486 |
14.9 |
183 |
27.5 |
150 |
15.7 |
15 |
9.6 |
2,103 |
5.2 |
| Marlborough |
1,287 |
3.7 |
591 |
15.3 |
207 |
35.9 |
96 |
18.3 |
45 |
30.6 |
2,100 |
5.4 |
| West Coast |
903 |
3.5 |
276 |
10.6 |
48 |
19.5 |
24 |
8.6 |
3 |
5.0 |
1,176 |
4.2 |
| Canterbury |
15,777 |
3.7 |
4,731 |
14.0 |
3,198 |
31.9 |
4,158 |
15.2 |
579 |
17.9 |
27,489 |
5.6 |
| Otago |
5,097 |
3.2 |
1,131 |
10.3 |
510 |
18.4 |
858 |
13.0 |
231 |
19.8 |
7,689 |
4.3 |
| Southland |
2,394 |
3.1 |
1,053 |
11.0 |
234 |
18.0 |
120 |
11.8 |
12 |
8.3 |
3,516 |
4.1 |
Household crowding, by age, 2006
| Region |
0 - 9 |
10 - 14 |
15 - 24 |
25 - 44 |
45 - 64 |
65+ |
Total |
| Number |
% |
Number |
% |
Number |
% |
Number |
% |
Number |
% |
Number |
% |
Number |
% |
| Northland |
4,482 |
22.3 |
2,214 |
18.9 |
2,979 |
19.7 |
3,792 |
12.0 |
1,836 |
5.3 |
381 |
2.1 |
15,678 |
11.9 |
| Auckland |
43,023 |
24.0 |
20,277 |
21.8 |
42,642 |
23.4 |
52,560 |
14.2 |
25,251 |
9.3 |
6,270 |
5.6 |
190,017 |
15.7 |
| Waikato |
8,742 |
16.3 |
4,209 |
14.5 |
7,848 |
15.9 |
8,550 |
9.0 |
3,879 |
4.6 |
786 |
1.9 |
34,017 |
9.6 |
| Bay of Plenty |
6,738 |
18.6 |
3,228 |
16.2 |
4,944 |
17.4 |
6,321 |
10.3 |
2,763 |
4.7 |
600 |
1.8 |
24,594 |
10.4 |
| Gisborne |
1,653 |
23.7 |
804 |
21.1 |
1,266 |
24.8 |
1,473 |
14.6 |
738 |
7.7 |
171 |
3.8 |
6,099 |
15.2 |
| Hawke's Bay |
3,936 |
19.1 |
1,839 |
16.0 |
3,000 |
18.0 |
3,585 |
10.2 |
1,683 |
4.8 |
309 |
1.7 |
14,349 |
10.5 |
| Taranaki |
1,551 |
11.3 |
804 |
10.2 |
1,320 |
11.1 |
1,449 |
5.7 |
633 |
2.6 |
108 |
0.8 |
5,871 |
6.1 |
| Manawatu-Whanganui |
3,849 |
12.9 |
1,851 |
11.1 |
3,306 |
11.5 |
3,591 |
6.8 |
1,617 |
3.2 |
327 |
1.2 |
14,535 |
7.1 |
| Wellington |
8,397 |
14.3 |
4,119 |
13.6 |
9,636 |
15.8 |
10,482 |
8.2 |
4,803 |
4.9 |
981 |
2.2 |
38,424 |
9.1 |
| Tasman |
480 |
8.1 |
231 |
6.8 |
411 |
9.4 |
537 |
4.9 |
270 |
2.3 |
36 |
0.7 |
1,959 |
4.7 |
| Nelson |
483 |
9.7 |
222 |
7.5 |
540 |
10.4 |
555 |
5.1 |
270 |
2.5 |
36 |
0.7 |
2,103 |
5.2 |
| Marlborough |
444 |
9.3 |
252 |
9.2 |
444 |
11.0 |
618 |
6.2 |
288 |
2.6 |
54 |
0.9 |
2,100 |
5.4 |
| West Coast |
282 |
7.8 |
162 |
7.2 |
222 |
7.4 |
321 |
4.2 |
159 |
2.0 |
24 |
0.7 |
1,176 |
4.2 |
| Canterbury |
5,769 |
8.9 |
2,979 |
8.5 |
7,299 |
10.8 |
7,368 |
5.3 |
3,432 |
2.8 |
642 |
1.0 |
27,489 |
5.6 |
| Otago |
1,458 |
6.9 |
687 |
5.8 |
2,421 |
8.3 |
2,139 |
4.5 |
858 |
1.9 |
123 |
0.5 |
7,689 |
4.3 |
| Southland |
921 |
7.7 |
465 |
6.9 |
795 |
7.4 |
912 |
4.0 |
366 |
1.7 |
60 |
0.6 |
3,516 |
4.1 |
Household crowding, by sex, 2006
| Region |
Male |
Female |
| Number |
% |
Number |
% |
| Northland |
7,587 |
11.8 |
8,097 |
12.1 |
| Auckland |
91,980 |
15.6 |
98,034 |
15.8 |
| Waikato |
16,482 |
9.5 |
17,535 |
9.7 |
| Bay of Plenty |
11,997 |
10.4 |
12,594 |
10.3 |
| Gisborne |
2,934 |
15.0 |
3,168 |
15.4 |
| Hawke's Bay |
6,909 |
10.4 |
7,440 |
10.6 |
| Taranaki |
2,931 |
6.2 |
2,940 |
6.0 |
| Manawatu-Whanganui |
7,095 |
7.1 |
7,443 |
7.0 |
| Wellington |
18,645 |
9.1 |
19,782 |
9.1 |
| Tasman |
969 |
4.7 |
984 |
4.7 |
| Nelson |
1,095 |
5.6 |
1,011 |
4.9 |
| Marlborough |
1,047 |
5.5 |
1,056 |
5.4 |
| West Coast |
627 |
4.4 |
546 |
3.9 |
| Canterbury |
13,596 |
5.6 |
13,893 |
5.5 |
| Otago |
3,882 |
4.5 |
3,804 |
4.2 |
| Southland |
1,704 |
4.0 |
1,812 |
4.2 |
|

