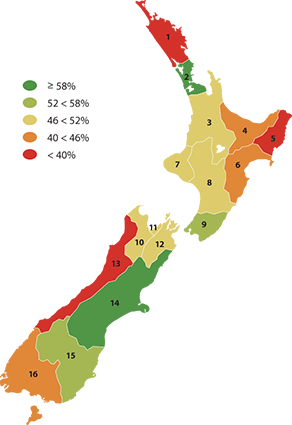
Language retention
The proportion of people who can speak a "first language" (excluding
English) of their ethnic group, for ethnic groups (other than Māori)
with an established resident population in New Zealand.

| Region |
% |
| 2001 |
2006 |
| 1 |
Northland |
32.4 |
33.4 |
| 2 |
Auckland |
62.4 |
63.7 |
| 3 |
Waikato |
48.3 |
51.7 |
| 4 |
Bay of Plenty |
40.6 |
43.8 |
| 5 |
Gisborne |
34.8 |
36.6 |
| 6 |
Hawke's Bay |
44.8 |
45.0 |
| 7 |
Taranaki |
43.8 |
46.5 |
| 8 |
Manawatu-Whanganui |
49.6 |
49.8 |
| 9 |
Wellington |
58.4 |
57.0 |
| 10 |
Tasman |
44.8 |
47.6 |
| 11 |
Nelson |
48.8 |
48.3 |
| 12 |
Marlborough |
42.4 |
47.0 |
| 13 |
West Coast |
33.6 |
34.5 |
| 14 |
Canterbury |
62.5 |
63.4 |
| 15 |
Otago |
54.7 |
56.2 |
| 16 |
Southland |
39.7 |
40.9 |
| Region |
Born in NZ |
Overseas born |
Total |
| % |
% |
% |
| 2001 |
2006 |
2001 |
2006 |
2001 |
2006 |
| Northland |
9.8 |
9.9 |
67.2 |
69.5 |
32.4 |
33.4 |
| Auckland |
36.4 |
36.6 |
78.7 |
78.8 |
62.4 |
63.7 |
| Waikato |
19.3 |
19.8 |
75.5 |
75.8 |
48.3 |
51.7 |
| Bay of Plenty |
13.0 |
14.3 |
72.4 |
73.6 |
40.6 |
43.8 |
| Gisborne |
15.6 |
14.3 |
66.8 |
73.4 |
34.8 |
36.6 |
| Hawke's Bay |
17.8 |
18.5 |
72.7 |
74.1 |
44.8 |
45.0 |
| Taranaki |
14.2 |
15.8 |
75.7 |
73.6 |
43.8 |
46.5 |
| Manawatu-Whanganui |
22.8 |
21.3 |
76.0 |
76.1 |
49.6 |
49.8 |
| Wellington |
36.7 |
34.1 |
80.3 |
78.9 |
58.4 |
57.0 |
| Tasman |
12.7 |
9.8 |
73.2 |
74.3 |
44.8 |
47.6 |
| Nelson |
17.7 |
16.9 |
70.4 |
71.0 |
48.8 |
48.3 |
| Marlborough |
14.9 |
19.9 |
71.2 |
70.6 |
42.4 |
47.0 |
| West Coast |
6.3 |
6.9 |
61.6 |
62.6 |
33.6 |
34.5 |
| Canterbury |
29.3 |
28.7 |
79.5 |
78.8 |
62.5 |
63.4 |
| Otago |
23.3 |
22.7 |
75.1 |
76.0 |
54.7 |
56.2 |
| Southland |
13.4 |
13.3 |
69.6 |
73.7 |
39.7 |
40.9 |
|