Life expectancy
Life expectancy at birth indicates the total number of years a
person could expect to live, based on the mortality rates of the
population at each age in a given year or period.
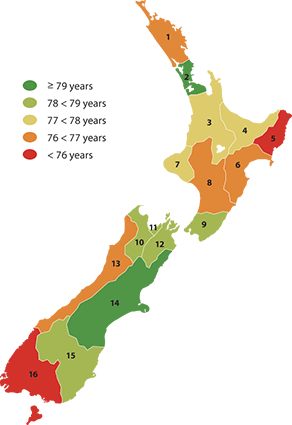
Life expectancy - male

| Region |
Life expectancy in years |
| 1990–1992 |
1995–1997 |
2000–2002 |
2005-2007 |
| 1 |
Northland |
71.7 |
72.8 |
74.0 |
76.3 |
| 2 |
Auckland |
73.2 |
75.2 |
77.5 |
79.4 |
| 3 |
Waikato |
72.5 |
74.3 |
75.9 |
77.2 |
| 4 |
Bay of Plenty |
72.5 |
73.0 |
75.4 |
77.1 |
| 5 |
Gisborne |
71.3 |
70.7 |
72.6 |
73.8 |
| 6 |
Hawke's Bay |
71.7 |
73.3 |
75.4 |
76.3 |
| 7 |
Taranaki |
72.3 |
74.9 |
75.9 |
77.2 |
| 8 |
Manawatu-Whanganui |
72.2 |
73.8 |
75.2 |
76.5 |
| 9 |
Wellington |
72.9 |
74.8 |
76.9 |
78.9 |
| 10 |
Tasman |
75.2 |
74.8 |
77.2 |
78.9 |
| 11 |
Nelson |
73.3 |
75.8 |
76.1 |
78.9 |
| 12 |
Marlborough |
74.6 |
74.4 |
76.8 |
78.1 |
| 13 |
West Coast |
70.4 |
72.3 |
74.2 |
76.9 |
| 14 |
Canterbury |
73.2 |
75.0 |
77.0 |
79.0 |
| 15 |
Otago |
73.1 |
74.7 |
76.8 |
78.7 |
| 16 |
Southland |
71.4 |
73.3 |
74.5 |
75.9 |
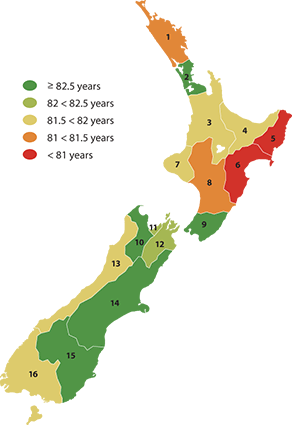
Life expectancy - female

| Region |
Life expectancy in years |
| 1990–1992 |
1995–1997 |
2000–2002 |
2005-2007 |
| 1 |
Northland |
78.2 |
78.6 |
80.1 |
81.2 |
| 2 |
Auckland |
79.2 |
80.2 |
82.1 |
83.2 |
| 3 |
Waikato |
78.5 |
80.0 |
81.0 |
81.8 |
| 4 |
Bay of Plenty |
78.0 |
79.2 |
80.5 |
81.9 |
| 5 |
Gisborne |
76.5 |
76.4 |
78.9 |
78.1 |
| 6 |
Hawke's Bay |
78.1 |
78.9 |
79.8 |
80.7 |
| 7 |
Taranaki |
78.6 |
80.3 |
80.6 |
81.5 |
| 8 |
Manawatu-Whanganui |
77.7 |
79.0 |
79.9 |
81.4 |
| 9 |
Wellington |
78.8 |
79.9 |
81.6 |
83.0 |
| 10 |
Tasman |
80.7 |
80.6 |
82.0 |
82.5 |
| 11 |
Nelson |
80.7 |
79.4 |
81.4 |
82.3 |
| 12 |
Marlborough |
79.4 |
79.6 |
80.6 |
82.1 |
| 13 |
West Coast |
77.1 |
78.4 |
81.4 |
81.6 |
| 14 |
Canterbury |
79.4 |
80.4 |
82.2 |
82.6 |
| 15 |
Otago |
79.0 |
80.4 |
81.7 |
82.7 |
| 16 |
Southland |
77.9 |
79.0 |
80.1 |
81.9 |
|