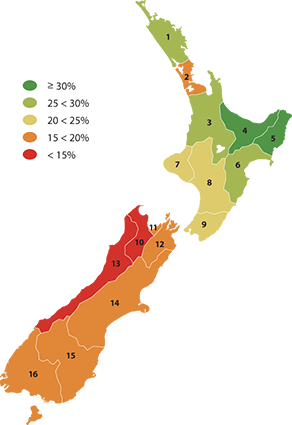
Māori language speakers
The number of Māori who can hold a conversation about everyday
things in Māori, as a proportion of the Māori population.

| Region |
Māori speakers (% of Māori
population) |
| 1996 |
2001 |
2006 |
| 1 |
Northland |
29.4 |
29.6 |
27.9 |
| 2 |
Auckland |
20.5 |
20.7 |
19.8 |
| 3 |
Waikato |
27.0 |
27.1 |
25.4 |
| 4 |
Bay of Plenty |
31.8 |
31.4 |
30.3 |
| 5 |
Gisborne |
34.4 |
34.1 |
31.8 |
| 6 |
Hawke's Bay |
27.1 |
26.7 |
25.3 |
| 7 |
Taranaki |
23.9 |
23.5 |
20.4 |
| 8 |
Manawatu-Whanganui |
25.2 |
24.9 |
23.8 |
| 9 |
Wellington |
24.1 |
24.3 |
22.6 |
| 10 |
Tasman |
14.8 |
16.3 |
14.7 |
| 11 |
Nelson |
16.8 |
19.8 |
18.4 |
| 12 |
Marlborough |
16.0 |
16.8 |
15.6 |
| 13 |
West Coast |
13.8 |
14.4 |
12.4 |
| 14 |
Canterbury |
16.8 |
18.0 |
16.3 |
| 15 |
Otago |
15.5 |
17.1 |
15.5 |
| 16 |
Southland |
17.6 |
18.7 |
16.4 |
Māori language speakers, 2006
| Region |
0 - 14 |
15 - 29 |
30 - 49 |
50 - 64 |
65+ |
Total |
| Number |
% |
Number |
% |
Number |
% |
Number |
% |
Number |
% |
Number |
% |
| Northland |
3,210 |
20.6 |
2,262 |
24.7 |
3,171 |
28.2 |
1,983 |
40.6 |
1,512 |
56.7 |
12,141 |
27.9 |
| Auckland |
6,858 |
14.2 |
6,777 |
19.1 |
7,734 |
21.1 |
3,840 |
30.7 |
1,956 |
46.1 |
27,162 |
19.8 |
| Waikato |
5,253 |
19.3 |
4,833 |
25.1 |
5,052 |
26.0 |
2,571 |
34.0 |
1,713 |
53.5 |
19,422 |
25.4 |
| Bay of Plenty |
5,919 |
24.5 |
4,503 |
29.3 |
5,295 |
30.0 |
2,898 |
40.4 |
1,896 |
56.9 |
20,511 |
30.3 |
| Gisborne |
1,728 |
25.4 |
1,302 |
30.3 |
1,569 |
30.1 |
909 |
40.0 |
768 |
65.5 |
6,276 |
31.8 |
| Hawke's Bay |
2,403 |
19.9 |
2,055 |
26.3 |
2,211 |
25.7 |
1,083 |
30.5 |
738 |
48.7 |
8,493 |
25.3 |
| Taranaki |
795 |
14.0 |
813 |
21.0 |
885 |
22.2 |
408 |
26.4 |
318 |
43.1 |
3,216 |
20.4 |
| Manawatu-Whanganui |
2,820 |
18.3 |
2,628 |
25.1 |
2,682 |
25.4 |
1,176 |
29.0 |
735 |
41.0 |
10,047 |
23.8 |
| Wellington |
3,372 |
17.7 |
3,282 |
22.7 |
3,561 |
23.8 |
1,581 |
30.7 |
756 |
41.9 |
12,552 |
22.6 |
| Tasman |
111 |
9.8 |
102 |
14.8 |
132 |
16.1 |
75 |
22.9 |
27 |
26.5 |
450 |
14.7 |
| Nelson |
195 |
15.2 |
198 |
20.6 |
174 |
18.0 |
72 |
24.5 |
24 |
21.6 |
666 |
18.4 |
| Marlborough |
129 |
9.2 |
171 |
17.4 |
192 |
16.4 |
129 |
25.3 |
48 |
22.2 |
666 |
15.6 |
| West Coast |
99 |
9.0 |
72 |
11.1 |
108 |
14.5 |
48 |
15.7 |
33 |
28.2 |
363 |
12.4 |
| Canterbury |
1,410 |
10.8 |
1,707 |
17.7 |
1,734 |
18.3 |
819 |
24.4 |
312 |
25.8 |
5,979 |
16.3 |
| Otago |
387 |
9.7 |
678 |
18.0 |
516 |
16.8 |
234 |
22.3 |
78 |
20.0 |
1,896 |
15.5 |
| Southland |
438 |
11.8 |
462 |
17.6 |
438 |
17.0 |
255 |
24.9 |
120 |
24.7 |
1,713 |
16.4 |
|