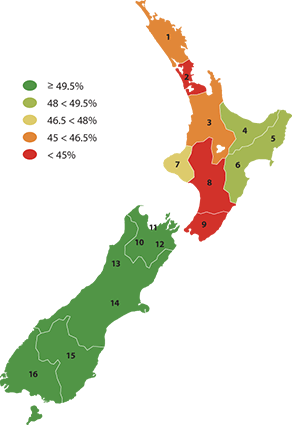
Participation in physical activity
The proportion of the population aged 16 years and over who met
physical activity guidelines (ie were physically active for at least 30
minutes a day on five or more days over the last week), as measured by
the 2007/2008 Active New Zealand Survey.

| Region |
% |
| 2007/2008 |
| 1 |
Northland |
45.0 |
| 2 |
Auckland |
44.0 |
| 3 |
Waikato |
46.0 |
| 4 |
Bay of Plenty |
48.0 |
| 5 |
Gisborne |
49.0 |
| 6 |
Hawke's Bay |
| 7 |
Taranaki |
47.0 |
| 8 |
Manawatu-Whanganui |
44.0 |
| 9 |
Wellington |
44.0 |
| 10 |
Tasman |
50.0 |
| 11 |
Nelson |
| 12 |
Marlborough |
| 13 |
West Coast |
53.0 |
| 14 |
Canterbury |
| 15 |
Otago |
51.0 |
| 16 |
Southland |
53.0 |
|