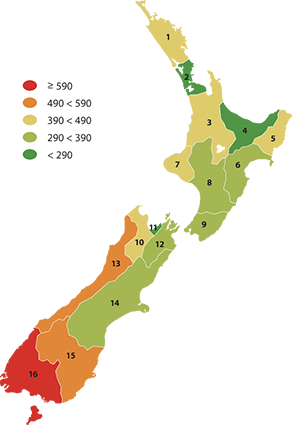
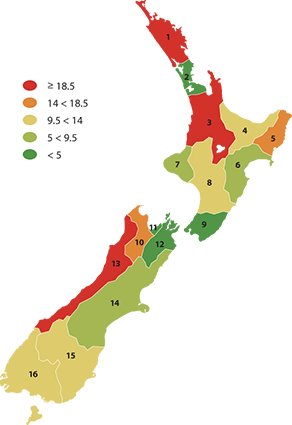
Road casualties
The number of people injured or killed in motor vehicle crashes per
100,000 of the total population.
Road casualties - injured

| Region |
Injuries per 100,000 population |
| 2001 |
2002 |
2003 |
2004 |
2005 |
2006 |
2007 |
2008 |
| 1 |
Northland |
301.8 |
333.6 |
482.9 |
493.2 |
453.6 |
479.9 |
492.2 |
425.3 |
| 2 |
Auckland |
271.5 |
293.9 |
312.0 |
299.6 |
292.0 |
312.8 |
294.0 |
285.3 |
| 3 |
Waikato |
402.4 |
414.9 |
446.3 |
442.8 |
431.9 |
436.0 |
457.6 |
445.3 |
| 4 |
Bay of Plenty |
248.5 |
318.3 |
329.1 |
293.9 |
272.0 |
289.6 |
317.5 |
279.7 |
| 5 |
Gisborne |
316.7 |
400.4 |
311.9 |
305.1 |
360.2 |
366.3 |
257.1 |
450.0 |
| 6 |
Hawke's Bay |
350.6 |
442.6 |
422.9 |
421.6 |
477.6 |
451.0 |
455.1 |
373.7 |
| 7 |
Taranaki |
388.9 |
404.7 |
407.8 |
361.1 |
367.6 |
389.5 |
413.2 |
419.5 |
| 8 |
Manawatu-Whanganui |
341.3 |
395.9 |
369.6 |
351.4 |
396.1 |
391.5 |
377.7 |
371.7 |
| 9 |
Wellington |
229.5 |
240.5 |
242.7 |
244.5 |
247.2 |
258.5 |
324.5 |
302.2 |
| 10 |
Tasman |
344.7 |
434.5 |
447.4 |
336.2 |
291.8 |
303.0 |
423.0 |
412.9 |
| 11 |
Nelson |
265.7 |
340.2 |
295.0 |
311.9 |
258.2 |
274.3 |
297.3 |
288.6 |
| 12 |
Marlborough |
333.3 |
384.4 |
304.6 |
347.5 |
346.6 |
405.1 |
425.0 |
386.5 |
| 13 |
West Coast |
465.8 |
383.1 |
504.9 |
428.1 |
498.4 |
596.7 |
524.8 |
530.9 |
| 14 |
Canterbury |
322.2 |
310.8 |
309.0 |
283.5 |
305.1 |
332.0 |
383.8 |
345.1 |
| 15 |
Otago |
570.6 |
740.8 |
650.4 |
649.1 |
680.1 |
640.8 |
640.6 |
562.2 |
| 16 |
Southland |
667.0 |
747.3 |
690.5 |
595.1 |
701.1 |
798.5 |
647.3 |
593.5 |
Road casualties - deaths

| Region |
Deaths per 100,000 population |
| 2001 |
2002 |
2003 |
2004 |
2005 |
2006 |
2007 |
2008 |
| 1 |
Northland |
18.5 |
24.8 |
22.5 |
20.3 |
14.8 |
19.4 |
19.5 |
18.7 |
| 2 |
Auckland |
5.4 |
6.2 |
6.1 |
6.1 |
5.5 |
6.0 |
3.9 |
3.7 |
| 3 |
Waikato |
25.3 |
17.4 |
21.4 |
22.3 |
25.5 |
17.3 |
23.8 |
18.6 |
| 4 |
Bay of Plenty |
17.6 |
12.0 |
20.5 |
13.6 |
8.8 |
13.7 |
13.4 |
10.7 |
| 5 |
Gisborne |
4.3 |
8.8 |
11.1 |
2.2 |
20.1 |
9.0 |
15.3 |
17.4 |
| 6 |
Hawke's Bay |
12.4 |
9.5 |
18.9 |
12.7 |
21.4 |
16.7 |
18.4 |
9.2 |
| 7 |
Taranaki |
16.5 |
12.3 |
9.5 |
14.2 |
12.4 |
11.4 |
10.3 |
6.5 |
| 8 |
Manawatu-Whanganui |
19.8 |
12.3 |
13.6 |
17.6 |
14.1 |
13.7 |
17.9 |
13.5 |
| 9 |
Wellington |
7.0 |
5.2 |
7.5 |
7.0 |
4.3 |
6.9 |
3.2 |
4.4 |
| 10 |
Tasman |
21.8 |
13.8 |
15.7 |
13.1 |
4.3 |
10.6 |
10.8 |
17.2 |
| 11 |
Nelson |
2.4 |
2.3 |
2.3 |
4.4 |
4.4 |
4.3 |
2.3 |
2.2 |
| 12 |
Marlborough |
7.5 |
36.5 |
16.8 |
23.6 |
7.0 |
6.9 |
9.1 |
2.2 |
| 13 |
West Coast |
55.9 |
51.9 |
16.3 |
32.7 |
19.7 |
13.1 |
18.6 |
24.7 |
| 14 |
Canterbury |
9.3 |
8.9 |
10.5 |
8.6 |
8.4 |
6.8 |
10.2 |
8.7 |
| 15 |
Otago |
12.3 |
5.8 |
9.9 |
9.2 |
8.6 |
7.1 |
11.4 |
10.3 |
| 16 |
Southland |
16.2 |
22.5 |
16.0 |
8.5 |
6.5 |
10.8 |
11.8 |
12.9 |
|