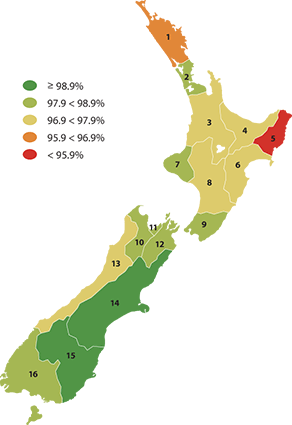
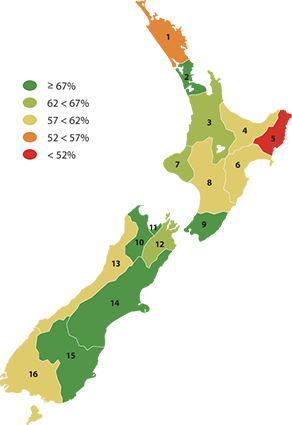
Telephone and internet access in the home
The proportion of the population with telephone and internet access
in the home.
Telephone access

| Region |
Telephone access (%) |
| 1996 |
2001 |
2006 |
| 1 |
Northland |
90.4 |
93.3 |
96.7 |
| 2 |
Auckland |
95.6 |
96.1 |
98.1 |
| 3 |
Waikato |
93.3 |
95.3 |
97.7 |
| 4 |
Bay of Plenty |
92.3 |
94.6 |
97.2 |
| 5 |
Gisborne |
90.3 |
91.2 |
95.8 |
| 6 |
Hawke's Bay |
94.2 |
95.2 |
97.4 |
| 7 |
Taranaki |
95.6 |
96.3 |
98.2 |
| 8 |
Manawatu-Whanganui |
94.4 |
96.0 |
97.8 |
| 9 |
Wellington |
96.0 |
97.4 |
98.6 |
| 10 |
Tasman |
94.5 |
97.0 |
98.5 |
| 11 |
Nelson |
96.6 |
97.6 |
98.7 |
| 12 |
Marlborough |
96.3 |
97.6 |
98.8 |
| 13 |
West Coast |
92.3 |
94.9 |
97.0 |
| 14 |
Canterbury |
97.3 |
98.0 |
98.9 |
| 15 |
Otago |
97.2 |
98.0 |
98.9 |
| 16 |
Southland |
96.1 |
97.1 |
98.7 |
Telephone access, by ethnicity, sex and age, 2006 (%)
| Region |
Ethnicity |
Sex |
Age |
Total |
| European |
Māori |
Pacific |
Asian |
Other |
Male |
Female |
0 - 14 |
15 - 24 |
25 - 44 |
45 - 64 |
65+ |
| 1 |
Northland |
98.3 |
92.7 |
94.8 |
98.2 |
98.4 |
96.3 |
96.9 |
95.6 |
95.7 |
96.1 |
97.6 |
98.4 |
96.7 |
| 2 |
Auckland |
99.1 |
94.6 |
94.8 |
98.8 |
98.9 |
98.0 |
98.2 |
97.3 |
97.7 |
98.2 |
98.7 |
98.9 |
98.1 |
| 3 |
Waikato |
98.8 |
93.8 |
95.1 |
98.2 |
98.5 |
97.5 |
97.9 |
97.2 |
97.0 |
97.6 |
98.3 |
98.8 |
97.7 |
| 4 |
Bay of Plenty |
98.8 |
92.8 |
93.3 |
97.9 |
97.7 |
97.0 |
97.3 |
96.0 |
96.2 |
96.8 |
98.1 |
98.9 |
97.2 |
| 5 |
Gisborne |
98.3 |
92.9 |
93.2 |
97.3 |
100.0 |
95.6 |
96.0 |
94.9 |
94.6 |
95.5 |
96.7 |
98.4 |
95.8 |
| 6 |
Hawke's Bay |
98.8 |
92.9 |
93.3 |
98.5 |
98.1 |
97.1 |
97.7 |
96.5 |
96.5 |
97.2 |
98.1 |
99.0 |
97.4 |
| 7 |
Taranaki |
98.8 |
93.9 |
93.4 |
97.3 |
97.3 |
97.9 |
98.5 |
97.8 |
97.8 |
98.0 |
98.6 |
98.8 |
98.2 |
| 8 |
Manawatu-Whanganui |
98.6 |
94.2 |
95.3 |
98.3 |
97.8 |
97.5 |
98.1 |
97.3 |
97.5 |
97.6 |
98.2 |
98.8 |
97.8 |
| 9 |
Wellington |
99.1 |
96.1 |
96.4 |
98.8 |
98.4 |
98.4 |
98.8 |
98.4 |
98.1 |
98.6 |
98.9 |
99.1 |
98.6 |
| 10 |
Tasman |
98.7 |
96.3 |
99.0 |
97.6 |
100.0 |
98.2 |
98.9 |
99.1 |
98.0 |
98.2 |
98.5 |
98.9 |
98.5 |
| 11 |
Nelson |
98.9 |
95.9 |
97.2 |
98.4 |
98.1 |
98.4 |
98.9 |
98.7 |
97.9 |
98.4 |
98.9 |
99.2 |
98.7 |
| 12 |
Marlborough |
99.0 |
96.7 |
96.4 |
98.3 |
95.8 |
98.5 |
99.1 |
99.0 |
98.7 |
98.4 |
98.9 |
99.1 |
98.8 |
| 13 |
West Coast |
97.3 |
94.4 |
98.8 |
95.6 |
95.2 |
96.3 |
97.7 |
97.5 |
95.8 |
96.3 |
97.1 |
98.2 |
97.0 |
| 14 |
Canterbury |
99.1 |
97.0 |
96.6 |
98.7 |
99.0 |
98.7 |
99.1 |
99.0 |
98.6 |
98.9 |
99.0 |
99.1 |
98.9 |
| 15 |
Otago |
99.0 |
97.6 |
98.1 |
98.5 |
96.1 |
98.6 |
99.1 |
99.4 |
98.3 |
98.7 |
98.9 |
99.2 |
98.9 |
| 16 |
Southland |
99.0 |
97.2 |
96.7 |
98.2 |
97.9 |
98.5 |
99.0 |
99.1 |
97.9 |
98.6 |
98.8 |
98.9 |
98.7 |
Internet access

| Region |
Internet access (%) |
| 2001 |
2006 |
| 1 |
Northland |
32.2 |
56.3 |
| 2 |
Auckland |
49.0 |
69.2 |
| 3 |
Waikato |
38.3 |
63.2 |
| 4 |
Bay of Plenty |
36.7 |
61.3 |
| 5 |
Gisborne |
28.8 |
51.6 |
| 6 |
Hawke's Bay |
36.2 |
60.8 |
| 7 |
Taranaki |
38.2 |
62.3 |
| 8 |
Manawatu-Whanganui |
37.8 |
61.5 |
| 9 |
Wellington |
50.2 |
71.4 |
| 10 |
Tasman |
38.0 |
67.5 |
| 11 |
Nelson |
42.0 |
67.3 |
| 12 |
Marlborough |
38.7 |
65.3 |
| 13 |
West Coast |
30.9 |
58.4 |
| 14 |
Canterbury |
43.5 |
69.4 |
| 15 |
Otago |
41.9 |
68.3 |
| 16 |
Southland |
34.5 |
61.9 |
Internet access, by ethnicity, sex and age, 2006 (%)
| Region |
Ethnicity |
Sex |
Age |
Total |
| European |
Māori |
Pacific |
Asian |
Other |
Male |
Female |
0 - 14 |
15 - 24 |
25 - 44 |
45 - 64 |
65+ |
| 1 |
Northland |
63.0 |
38.6 |
38.5 |
66.8 |
69.7 |
56.6 |
55.9 |
56.9 |
53.3 |
60.1 |
63.4 |
37.2 |
56.3 |
| 2 |
Auckland |
75.9 |
49.5 |
35.1 |
78.8 |
75.7 |
70.3 |
68.2 |
67.9 |
71.6 |
72.6 |
74.2 |
45.2 |
69.2 |
| 3 |
Waikato |
67.8 |
42.3 |
43.6 |
72.8 |
68.0 |
63.7 |
62.6 |
66.3 |
62.7 |
67.7 |
68.0 |
37.4 |
63.2 |
| 4 |
Bay of Plenty |
68.1 |
41.2 |
42.3 |
63.5 |
74.0 |
62.2 |
60.5 |
63.0 |
58.3 |
65.0 |
68.7 |
41.3 |
61.3 |
| 5 |
Gisborne |
62.5 |
38.9 |
36.6 |
60.7 |
69.0 |
52.2 |
51.0 |
52.8 |
50.0 |
55.3 |
58.1 |
28.9 |
51.6 |
| 6 |
Hawke's Bay |
66.8 |
40.6 |
36.8 |
59.2 |
66.7 |
61.8 |
59.8 |
63.2 |
60.2 |
65.2 |
67.1 |
36.2 |
60.8 |
| 7 |
Taranaki |
64.5 |
45.1 |
42.5 |
74.9 |
80.0 |
63.1 |
61.6 |
68.5 |
63.5 |
67.7 |
67.3 |
32.0 |
62.3 |
| 8 |
Manawatu-Whanganui |
64.4 |
45.1 |
42.0 |
71.8 |
73.5 |
62.4 |
60.8 |
65.9 |
62.9 |
67.0 |
66.4 |
33.8 |
61.5 |
| 9 |
Wellington |
75.3 |
54.9 |
43.8 |
77.1 |
64.8 |
72.4 |
70.4 |
74.8 |
72.2 |
75.0 |
75.3 |
44.8 |
71.4 |
| 10 |
Tasman |
68.1 |
56.7 |
47.5 |
65.3 |
75.8 |
67.9 |
67.1 |
76.1 |
68.2 |
69.9 |
71.8 |
38.0 |
67.5 |
| 11 |
Nelson |
68.5 |
51.9 |
45.1 |
67.8 |
84.6 |
68.2 |
66.5 |
74.0 |
67.3 |
70.3 |
73.1 |
39.9 |
67.3 |
| 12 |
Marlborough |
66.7 |
51.2 |
40.6 |
67.6 |
58.3 |
65.7 |
64.9 |
72.8 |
64.5 |
69.7 |
70.6 |
38.8 |
65.3 |
| 13 |
West Coast |
58.8 |
48.6 |
43.8 |
67.0 |
81.0 |
58.0 |
58.8 |
68.5 |
58.5 |
64.2 |
59.9 |
26.9 |
58.4 |
| 14 |
Canterbury |
69.9 |
56.7 |
42.9 |
79.1 |
75.5 |
70.3 |
68.5 |
77.1 |
72.7 |
74.6 |
72.5 |
36.5 |
69.4 |
| 15 |
Otago |
68.5 |
59.4 |
51.9 |
76.1 |
69.4 |
68.9 |
67.6 |
77.4 |
70.8 |
73.1 |
71.4 |
36.2 |
68.3 |
| 16 |
Southland |
62.8 |
50.5 |
45.7 |
67.6 |
81.3 |
62.7 |
61.2 |
70.9 |
61.5 |
68.4 |
64.7 |
27.9 |
61.9 |
|