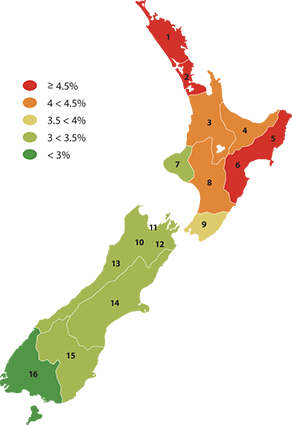
Unemployment (%)
The number of people aged 15 years and over who are not employed and
who are actively seeking and available for paid work, expressed as a
percentage of the total labour force.
| Region |
Population 15 years and over who are unemployed (% of total labour force) |
| 1986 |
1991 |
1996 |
2001 |
2002 |
2003 |
2004 |
2005 |
2006 |
2007 |
2008 |
| 1 |
Northland |
6.4 |
13.9 |
9.9 |
8.2 |
9.5 |
8.5 |
4.8 |
5.7 |
5.2 |
4.3 |
5.8 |
| 2 |
Auckland |
3.2 |
11.6 |
5.3 |
5.0 |
4.8 |
4.0 |
3.9 |
3.7 |
3.7 |
3.9 |
4.7 |
| 3 |
Waikato |
5.4 |
11.0 |
7.2 |
6.2 |
5.6 |
4.7 |
3.3 |
4.3 |
3.5 |
3.7 |
4.3 |
| 4 |
Bay of Plenty |
4.6 |
12.7 |
8.4 |
8.4 |
7.6 |
6.7 |
5.1 |
4.2 |
4.2 |
3.6 |
4.4 |
| 5 |
Gisborne |
5.1 |
11.3 |
7.8 |
6.7 |
5.3 |
5.4 |
5.2 |
5.3 |
4.3 |
4.8 |
5.9 |
| 6 |
Hawke's Bay |
| 7 |
Taranaki |
5.5 |
12.2 |
7.4 |
5.8 |
5.3 |
5.1 |
4.5 |
3.6 |
3.4 |
3.3 |
3.4 |
| 8 |
Manawatu-Whanganui |
4.5 |
11.5 |
6.6 |
5.3 |
5.2 |
4.8 |
4.4 |
4.4 |
4.6 |
5.3 |
4.2 |
| 9 |
Wellington |
2.8 |
8.4 |
6.3 |
4.3 |
5.0 |
5.4 |
4.4 |
3.8 |
4.9 |
3.5 |
3.9 |
| 10 |
Tasman |
3.3 |
8.6 |
6.0 |
3.5 |
3.5 |
3.5 |
2.6 |
2.7 |
3.2 |
2.8 |
3.3 |
| 11 |
Nelson |
| 12 |
Marlborough |
| 13 |
West Coast |
| 14 |
Canterbury |
4.2 |
9.3 |
6.2 |
5.5 |
5.0 |
4.2 |
3.7 |
3.0 |
3.0 |
3.0 |
3.1 |
| 15 |
Otago |
5.8 |
8.3 |
5.0 |
5.5 |
6.0 |
5.7 |
3.9 |
3.7 |
3.8 |
3.3 |
3.2 |
| 16 |
Southland |
5.0 |
9.2 |
4.9 |
3.5 |
3.6 |
3.6 |
3.8 |
2.7 |
3.0 |
2.4 |
2.6 |
Unemployment rate, by age and sex, 2008 ('..s' indicates numbers
below 1,000)
| Region |
15 - 24 |
25 - 44 |
45 - 64 |
Male |
Female |
Total 15+ |
| Number |
% |
Number |
% |
Number |
% |
Number |
% |
Number |
% |
Number |
% |
| Northland |
1,600 |
14.5 |
1,700 |
5.8 |
..s |
..s |
2,600 |
6.8 |
1,500 |
4.6 |
4,200 |
5.8 |
| Auckland |
15,300 |
12.6 |
11,300 |
3.6 |
6,100 |
2.5 |
16,800 |
4.5 |
16,100 |
4.9 |
32,900 |
4.7 |
| Waikato |
4,100 |
10.4 |
3,500 |
4.0 |
1,700 |
2.1 |
5,200 |
4.4 |
4,200 |
4.2 |
9,400 |
4.3 |
| Bay of Plenty |
2,500 |
13.0 |
1,600 |
3.3 |
1,200 |
2.5 |
2,700 |
4.2 |
2,600 |
4.7 |
5,300 |
4.4 |
| Gisborne |
2,900 |
17.3 |
2,100 |
4.8 |
1,200 |
2.9 |
3,000 |
5.6 |
3,300 |
6.2 |
6,300 |
5.9 |
| Hawke's Bay |
| Taranaki |
1,000 |
11.2 |
..s |
..s |
..s |
..s |
..s |
..s |
1,100 |
4.2 |
2,100 |
3.4 |
| Manawatu-Whanganui |
2,100 |
9.9 |
1,700 |
3.7 |
1,100 |
2.4 |
2,200 |
3.6 |
2,700 |
4.9 |
4,900 |
4.2 |
| Wellington |
5,700 |
12.6 |
3,500 |
2.6 |
1,800 |
1.8 |
5,900 |
4.1 |
5,100 |
3.8 |
11,000 |
3.9 |
| Tasman |
1,200 |
7.9 |
..s |
..s |
..s |
..s |
1,700 |
3.4 |
1,400 |
3.2 |
3,100 |
3.3 |
| Nelson |
| Marlborough |
| West Coast |
| Canterbury |
5,600 |
8.9 |
3,200 |
2.1 |
2,300 |
1.8 |
6,600 |
3.5 |
4,600 |
2.8 |
11,200 |
3.1 |
| Otago |
1,600 |
8.3 |
1,000 |
2.7 |
..s |
..s |
1,300 |
2.5 |
1,800 |
3.9 |
3,100 |
3.2 |
| Southland |
..s |
..s |
..s |
..s |
..s |
..s |
..s |
..s |
..s |
..s |
1,400 |
2.6 |
|

