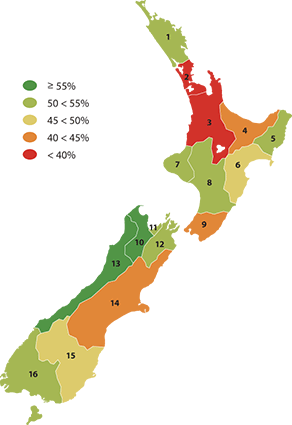
Voter turnout - local authority elections
The proportion of all enrolled electors (both resident and
ratepayer) who cast a vote in local authority elections for regional
councils.

| Region |
Enrolled electors who voted (%) |
| 1989 |
1992 |
1995 |
1998 |
2001 |
2004 |
2007 |
| 1 |
Northland |
66.0 |
59.0 |
56.0 |
60.0 |
45.0 |
49.0 |
51.0 |
| 2 |
Auckland |
40.0 |
44.0 |
34.0 |
46.0 |
43.0 |
42.0 |
38.0 |
| 3 |
Waikato |
57.0 |
54.0 |
53.0 |
57.0 |
49.0 |
45.0 |
37.0 |
| 4 |
Bay of Plenty |
61.0 |
61.0 |
54.0 |
54.0 |
52.0 |
45.0 |
44.0 |
| 5 |
Gisborne |
74.0 |
72.0 |
61.0 |
67.0 |
63.0 |
52.0 |
52.0 |
| 6 |
Hawke's Bay |
60.0 |
57.0 |
58.0 |
56.0 |
55.0 |
47.0 |
45.0 |
| 7 |
Taranaki |
69.0 |
62.0 |
57.0 |
61.0 |
61.0 |
55.0 |
52.0 |
| 8 |
Manawatu-Whanganui |
63.0 |
54.0 |
58.0 |
53.0 |
53.0 |
54.0 |
51.0 |
| 9 |
Wellington |
52.0 |
50.0 |
51.0 |
52.0 |
50.0 |
43.0 |
43.0 |
| 10 |
Tasman |
75.0 |
67.0 |
64.0 |
63.0 |
59.0 |
52.0 |
55.0 |
| 11 |
Nelson |
66.0 |
70.0 |
56.0 |
56.0 |
53.0 |
48.0 |
51.0 |
| 12 |
Marlborough |
72.0 |
65.0 |
66.0 |
68.0 |
66.0 |
62.0 |
52.0 |
| 13 |
West Coast |
74.0 |
70.0 |
70.0 |
72.0 |
79.0 |
68.0 |
57.0 |
| 14 |
Canterbury |
64.0 |
54.0 |
51.0 |
56.0 |
52.0 |
43.0 |
44.0 |
| 15 |
Otago |
69.0 |
58.0 |
57.0 |
66.0 |
61.0 |
56.0 |
49.0 |
| 16 |
Southland |
71.0 |
65.0 |
64.0 |
68.0 |
59.0 |
56.0 |
51.0 |
|