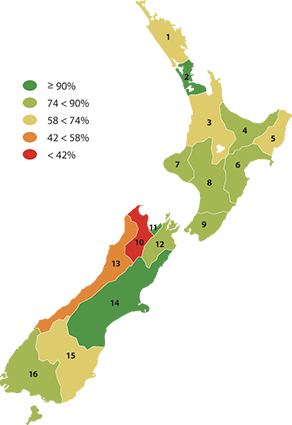
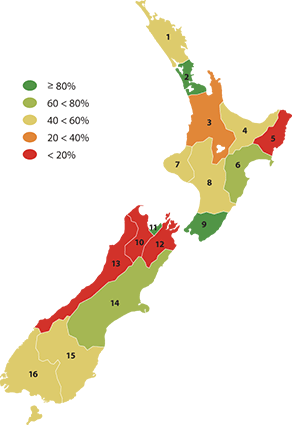
Drinking water quality (can be more than 100% and highly variable)
The proportion of the estimated resident population who receive
their water from community water supplies whose drinking water complies
with either the 2000 or 2005 Drinking-water standards for New Zealand
relating to E. coli and Cryptosporidium.
Drinking water quality - E. coli

| Region |
E. coli compliance (% of population) |
| 2001 |
2002 |
2003 |
2004 |
2005 |
2006/2007 |
2007/2008 |
| 1 |
Northland |
63.2 |
29.3 |
61.6 |
58.4 |
27.4 |
57.4 |
60.3 |
| 2 |
Auckland |
90.3 |
88.7 |
85.9 |
89.9 |
90.3 |
91.2 |
90.3 |
| 3 |
Waikato |
64.4 |
27.9 |
43.7 |
48.5 |
58.3 |
64.4 |
66.5 |
| 4 |
Bay of Plenty |
45.2 |
75.5 |
58.3 |
61.2 |
52.0 |
51.1 |
83.3 |
| 5 |
Gisborne |
68.5 |
68.6 |
67.2 |
65.9 |
67.9 |
69.8 |
67.7 |
| 6 |
Hawke's Bay |
81.8 |
81.4 |
78.8 |
82.9 |
83.3 |
79.9 |
75.4 |
| 7 |
Taranaki |
56.6 |
58.1 |
77.9 |
59.4 |
77.2 |
76.5 |
76.0 |
| 8 |
Manawatu-Whanganui |
54.9 |
79.3 |
79.5 |
67.1 |
80.1 |
53.0 |
85.0 |
| 9 |
Wellington |
81.3 |
91.0 |
73.4 |
90.2 |
84.6 |
87.8 |
86.9 |
| 10 |
Tasman |
89.4 |
97.3 |
88.9 |
43.4 |
39.8 |
43.2 |
41.9 |
| 11 |
Nelson |
117.7 |
117.4 |
116.0 |
97.7 |
97.7 |
97.0 |
96.6 |
| 12 |
Marlborough |
70.3 |
3.8 |
1.3 |
3.5 |
4.8 |
75.3 |
75.2 |
| 13 |
West Coast |
60.9 |
57.2 |
59.0 |
34.0 |
33.3 |
35.0 |
46.9 |
| 14 |
Canterbury |
14.5 |
70.5 |
73.6 |
69.8 |
76.8 |
90.8 |
90.5 |
| 15 |
Otago |
6.2 |
14.8 |
25.4 |
55.3 |
67.9 |
69.0 |
69.3 |
| 16 |
Southland |
4.8 |
12.6 |
68.5 |
66.4 |
70.7 |
66.5 |
77.6 |
Drinking water quality - Cryptosporidium

| Region |
Cryptosporidium compliance (% of population) |
| 2001 |
2002 |
2003 |
2004 |
2005 |
2006/2007 |
2007/2008 |
| 1 |
Northland |
12.7 |
13.8 |
1.0 |
0.9 |
3.5 |
46.8 |
48.4 |
| 2 |
Auckland |
87.6 |
86.0 |
45.7 |
86.3 |
87.2 |
88.4 |
87.4 |
| 3 |
Waikato |
10.3 |
39.9 |
43.0 |
42.2 |
40.3 |
34.6 |
33.5 |
| 4 |
Bay of Plenty |
16.2 |
15.3 |
46.3 |
42.1 |
46.0 |
49.0 |
48.6 |
| 5 |
Gisborne |
0.0 |
65.9 |
65.5 |
66.3 |
66.1 |
0.0 |
0.0 |
| 6 |
Hawke's Bay |
59.1 |
78.2 |
78.6 |
51.9 |
56.0 |
78.2 |
75.2 |
| 7 |
Taranaki |
0.0 |
45.3 |
46.1 |
45.7 |
50.2 |
50.5 |
50.4 |
| 8 |
Manawatu-Whanganui |
40.6 |
42.2 |
49.9 |
39.6 |
59.3 |
54.2 |
56.7 |
| 9 |
Wellington |
79.4 |
88.1 |
82.6 |
74.8 |
78.3 |
83.7 |
83.0 |
| 10 |
Tasman |
8.7 |
8.5 |
9.1 |
31.5 |
31.2 |
4.3 |
4.3 |
| 11 |
Nelson |
0.0 |
0.0 |
0.0 |
97.7 |
97.7 |
96.8 |
96.2 |
| 12 |
Marlborough |
0.0 |
0.0 |
0.0 |
0.0 |
0.0 |
0.0 |
0.0 |
| 13 |
West Coast |
17.0 |
18.2 |
0.0 |
0.4 |
0.4 |
1.0 |
1.0 |
| 14 |
Canterbury |
59.2 |
58.3 |
62.7 |
65.0 |
64.2 |
66.8 |
63.2 |
| 15 |
Otago |
0.5 |
0.2 |
5.1 |
5.7 |
4.8 |
47.6 |
52.4 |
| 16 |
Southland |
9.0 |
61.7 |
7.8 |
6.8 |
6.4 |
59.8 |
57.7 |
|