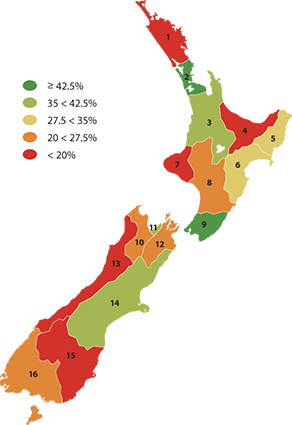
Representation of women in government
The proportion of female elected members of regional councils in local authority elections.

| Region |
% |
| 2001 |
2004 |
2007 |
| 1 |
Northland |
25.0 |
13.0 |
13.0 |
| 2 |
Auckland |
38.0 |
46.0 |
46.0 |
| 3 |
Waikato |
50.0 |
36.0 |
42.0 |
| 4 |
Bay of Plenty |
33.0 |
7.0 |
15.0 |
| 5 |
Gisborne |
29.0 |
36.0 |
29.0 |
| 6 |
Hawke's Bay |
33.0 |
33.0 |
33.0 |
| 7 |
Taranaki |
10.0 |
10.0 |
9.0 |
| 8 |
Manawatu-Whanganui |
18.0 |
27.0 |
25.0 |
| 9 |
Wellington |
31.0 |
38.0 |
46.0 |
| 10 |
Tasman |
15.0 |
23.0 |
23.0 |
| 11 |
Nelson |
42.0 |
25.0 |
42.0 |
| 12 |
Marlborough |
25.0 |
25.0 |
23.0 |
| 13 |
West Coast |
0.0 |
0.0 |
0.0 |
| 14 |
Canterbury |
21.0 |
36.0 |
36.0 |
| 15 |
Otago |
17.0 |
17.0 |
18.0 |
| 16 |
Southland |
17.0 |
17.0 |
25.0 |
|