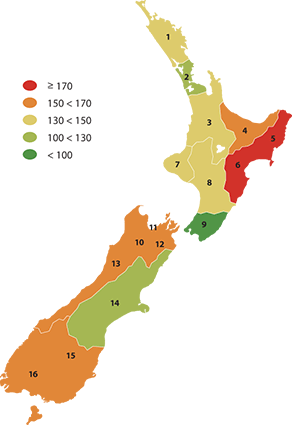
Workplace injury claims
The number of workplace accident insurance claims reported to the
Accident Compensation Corporation (ACC) per 1,000 full-time equivalent
employees (FTEs), excluding those employees who received accident and
emergency treatment only.

| Region |
Rate per
1,000 FTEs |
| 2002 |
2003 |
2004 |
2005 |
2006 |
2007 |
| 1 |
Northland |
200.1 |
196.0 |
192.5 |
164.5 |
158.9 |
148.0 |
| 2 |
Auckland |
118.2 |
119.8 |
118.7 |
116.8 |
109.6 |
105.0 |
| 3 |
Waikato |
172.0 |
167.1 |
175.9 |
171.8 |
155.1 |
143.0 |
| 4 |
Bay of Plenty |
171.4 |
178.2 |
173.9 |
197.2 |
174.4 |
157.0 |
| 5 |
Gisborne |
189.7 |
194.1 |
187.1 |
179.7 |
171.5 |
180.0 |
| 6 |
Hawke's Bay |
| 7 |
Taranaki |
163.6 |
155.4 |
155.8 |
143.2 |
140.1 |
134.0 |
| 8 |
Manawatu-Whanganui |
155.4 |
149.7 |
148.5 |
136.0 |
134.7 |
139.0 |
| 9 |
Wellington |
81.8 |
80.3 |
77.2 |
74.1 |
68.9 |
69.0 |
| 10 |
Tasman |
163.0 |
165.1 |
149.0 |
143.6 |
146.8 |
150.0 |
| 11 |
Nelson |
| 12 |
Marlborough |
| 13 |
West Coast |
| 14 |
Canterbury |
145.5 |
147.6 |
136.2 |
121.9 |
118.5 |
118.0 |
| 15 |
Otago |
170.8 |
243.6 |
154.3 |
160.4 |
162.8 |
160.0 |
| 16 |
Southland |
|