| Introduction | | People | | Health | | Knowledge & Skills | | Paid Work | | Economic Standard of Living | | Civil & Political Rights |
| Cultural Identity | | Leisure & Recreation | | Safety | | Social Connectedness | | Life Satisfaction | | Summary | | Notes & References |
DownloadSocial Report 2010 - PDF, 4.71Mb |
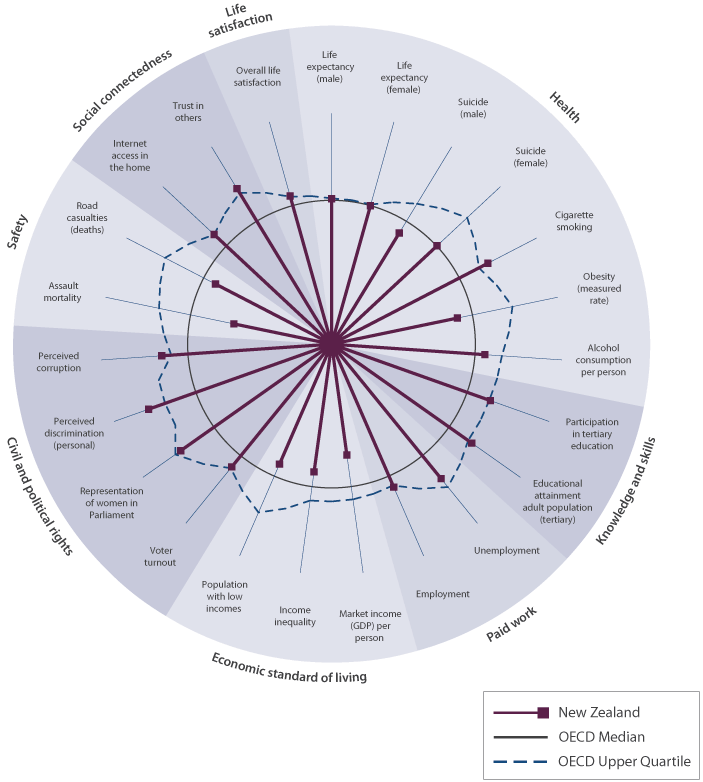
Social wellbeing in New Zealand compared to OECD countriesNew Zealand compares favourably to other OECD countriesFor many indicators, New Zealand compares very well with other countries. New Zealand’s outcomes are better than, or similar to, the OECD median for around two-thirds of the 22 indicators for which there is internationally-comparable data. New Zealand performs very well in the Civil and Political Rights domain. We ranked first as the least corrupt of 30 OECD countries in 2009, and we are in the top third of those countries for the proportion of women in government and for voter turnout. We have a lower rate of perceived personal discrimination than many other developed countries (10 percent in 2008, compared to a median of 16 percent across 19 European OECD countries in 2009). Paid work is another area in which New Zealand performs strongly, with a relatively high employment rate, the sixth highest in the OECD in 2009, and a relatively low unemployment rate, the 11th lowest in 2009. We also perform well in the Social Connectedness area, with New Zealanders having a higher level of trust in others and a higher level of households with internet access than the OECD median. New Zealand adults are as likely as Australian adults to do voluntary work for groups or organisations. In the area of Knowledge and Skills, New Zealand is above the OECD median for the proportion of adults who have a bachelor’s degree or higher qualification, and for participation in tertiary education among 20–29 year olds. The proportion of New Zealand adults with prose and document literacy and numeracy skills in English at Level 3 or above is similar to the proportions in Australia and English-speaking Canada, and higher than the proportion in the United States. In the Leisure and Recreation domain, New Zealand adults have a relatively high level of attendance at art events, compared to a range of other developed countries. In the Health domain, New Zealand’s results are mixed. Our life expectancy is similar to the OECD median, although there is a relatively narrow range of outcomes across the OECD for this indicator. New Zealand’s rates of cigarette smoking and alcohol consumption are lower than the OECD median. Among the 12 countries that use actual measurements of obesity rather than self-reporting, our obesity rate is similar to those of Australia, the United Kingdom and Canada and lower than that of the United States. We have relatively high suicide death rates, particularly for youth. New Zealand does not perform well in the Safety domain. Our road user death rate was higher than the OECD median in 2008. Our assault death rate was higher than the OECD median for 29 OECD countries with data from 2003–2008. Our Economic Standard of Living results tend to be lower than those in many OECD countries. In 2008, New Zealand was below the OECD median for market income per person, using gross domestic product (GDP) per capita as the measure. In 2004, New Zealand was higher than the OECD median for income inequality and near the middle of the OECD for population with low incomes. New Zealanders’ overall life satisfaction was higher than the median for people in other OECD countries in 2006. Figure IC1 Social wellbeing in New Zealand, relative to the OECD
Interpreting "Social indicators in New Zealand relative to the OECD"This figure shows New Zealanders’ social wellbeing relative to that of people in OECD countries for 22 indicators. The circle For each indicator, the most recent data has been used where possible. Most of the data is for the years between 2006 and 2009, but the population with low incomes and income inequality data is for 2004 and the assault mortality data is for 2003–2005. SOME CAUTION IS REQUIRED WITH THIS DATA: international comparisons are difficult to interpret because of the different methods countries use to collect, classify and record social data. There were too few countries with adult literacy data to include this indicator in the figure. Perceived personal discrimination includes New Zealand and 19 OECD countries in the European Union. Obesity includes only the 12 OECD countries which use actual measurements, rather than self-reporting. |