| Introduction | | People | | Health | | Knowledge & Skills | | Paid Work | | Economic Standard of Living | | Civil & Political Rights |
| Cultural Identity | | Leisure & Recreation | | Safety | | Social Connectedness | | Life Satisfaction | | Summary | | Notes & References |
DownloadKnowledge and Skills - PDF, 302kb |
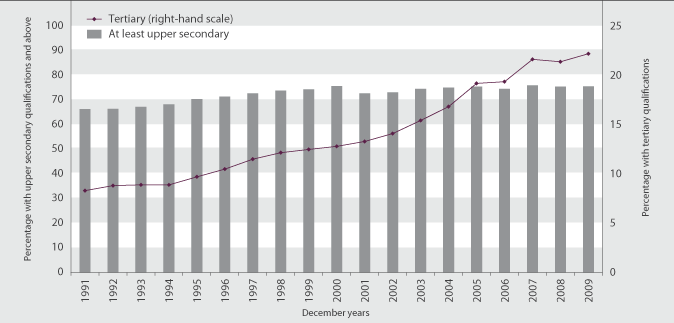
Educational attainment of the adult populationDefinitionThe proportion of adults aged 25–64 years with an educational attainment of (1) at least upper secondary school level, and (2) bachelor’s degree or higher. At least upper secondary school level includes any formal qualification at NCEA Level 1 (or its predecessor, School Certificate) or higher. Bachelor’s degree or higher includes bachelor’s degrees, postgraduate certificates or diplomas, master’s degrees, and doctorates. RelevanceThe educational attainment of the adult population is an indicator of the skills available in the economy. The level of formal educational qualifications in the population is a commonly used proxy for the stock of “human capital”, ie the skills available in the population and labour force. Current level and trendsIn the year ended December 2009, 75 percent of the population aged 25–64 years (1.68 million people) had attained an educational qualification at upper secondary school level or above. This was the same proportion as in 2008 but a substantial increase from 62 percent in 1991. The proportion of adults with a bachelor’s degree or higher qualification rose from 8 percent in 1991 to 21 percent in 2008, and reached 22 percent in 2009 (492,000 people). Figure K4.1 Proportion of adults aged 25–64 years with an educational qualification of at least upper secondary level and tertiary level, 1991–2009
Source: Statistics New Zealand, Household Labour Force Survey Age and sex differencesYounger adults aged 25–34 years are much more likely to have at least upper secondary school qualifications or a bachelor’s degree or higher than adults aged 55–64 years. Sex differences in educational attainment have narrowed over time. For younger age groups, women are more likely than men to have higher qualifications. Table K4.1 Proportion (%) of population aged 25–64 years with higher qualifications, by age group and sex, 2009
Source: Statistics New Zealand, Household Labour Force Survey Ethnic differencesThere are marked ethnic differences in adult educational attainment. In 2009, 79 percent of European adults aged 25–64 years held at least upper secondary school qualifications, compared with 65 percent of Māori adults and 52 percent of Pacific adults. The proportion was 71 percent for the combined Asian, Middle Eastern, Latin American, African and Other ethnic group category. The latter group had the highest proportion of adults with a tertiary degree at bachelor’s degree level or above (37 percent), followed by European adults (22 percent), Māori adults (10 percent) and Pacific adults (8 percent). However, while the proportion of adults with a tertiary qualification at bachelor’s degree level or above almost doubled in the decade to 2009, it was around two and a half times higher for Māori and Pacific adults. Table K4.2 Proportion (%) of population aged 25–64 years with higher qualifications, by ethnic group, selected years, 1991–2009
Source: Statistics New Zealand, Household Labour Force Survey International comparisonIn OECD figures for 2007, 72 percent of New Zealand adults had at least upper secondary level qualifications, similar to the OECD median of 73 percent. New Zealand ranked 16th highest out of 29 OECD countries. In the proportion of adults with bachelor’s degrees or higher, New Zealand ranked fifth equal (with Denmark and Canada) out of 30 OECD countries, with a rate of 25 percent. This was above the OECD median of 20 percent. Countries that had higher proportions of adults with tertiary qualifications at this level included Norway (32 percent, the highest rate) and the United States (31 percent). Australia (24 percent), the United Kingdom (23 percent) and Ireland (21 percent) had lower proportions than New Zealand. Among 25–34 year olds, New Zealand ranked fourth with 33 percent having tertiary qualifications at bachelor’s degree level or higher. This was above the United States and Australia (31 percent), Ireland (30 percent) and Canada and the United Kingdom (both 29 percent). New Zealand is among the 25 OECD countries in which females aged 25–34 years are more likely than males of that age to have tertiary qualifications at bachelor’s degree level or higher. » View technical details about the educational attainment of the adult population indicator |
|||||||||||||||||||||||||||||||||||||||||||||||||||||||||||||||||||||||||||||||||||||||||||||||||||||||||||||||||||||||||||||||||||||||||