Life expectancy
Definition
Life expectancy at birth indicates the total number of years a person
could expect to live, based on the mortality rates of the population at
each age in a given year or period.
Relevance
Life expectancy at birth is a key summary indicator of fatal
health outcomes, ie the survival experience of the population.
Current level and trends
Based on the mortality experiences of New Zealanders in the
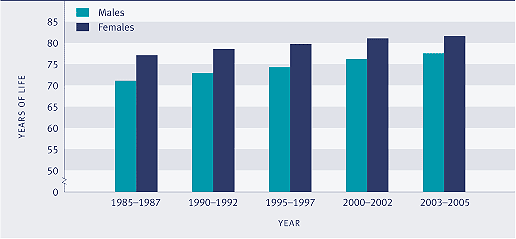
period 2003–2005, life expectancy at birth was 77.5 years for males and
81.7 years for females. Since the mid-1980s, gains in longevity have
been greater for males than for females. Between 1985–1987 and
2003–2005, life expectancy at birth increased by 6.4 years for males
and 4.6 years for females. As a result, the sex gap in life expectancy
decreased from 6 years to 4.2 years over this period.
With the decline in the infant mortality rate (from 11.2
deaths per 1,000 live births in 1986 to 5.1 per 1,000 in 2005), the
impact of infant death on life expectancy has lessened. The gains in
life expectancy since the mid-1980s can be attributed mainly to reduced
mortality in the middle-aged and older age groups (45–84 years).
Reduced mortality rates are due to better living standards and improved
public and personal health care.
Figure H2.1 Life expectancy at birth, by
sex, selected years, 1985–1987 to 2003–2005

Source: Statistics New Zealand
Ethnic differences
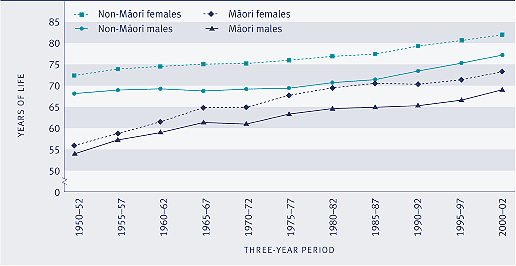
There are marked ethnic differences in life expectancy. In
2000–2002, male life expectancy at birth was 77.2 years for non-Māori
and 69.0 years for Māori, a difference of 8.2 years. Female life
expectancy at birth was 81.9 years for non-Māori and 73.2 years for
Māori, a difference of 8.8 years.
The pace of improvement in life expectancy has varied by
ethnic group. For non-Māori, there was a fairly steady increase in life
expectancy at birth over the period from 1985–1987 to 2000–2002, males
gaining 5.8 years and females 4.5 years. For Māori, there was little
change during the 1980s, but a dramatic improvement in the five years
to 2000–2002. While the gain in Māori life expectancy over the whole
period 1985–1987 to 2000–2002 (4.1 years for males, 2.7 years for
females) was less than that for non-Māori, Māori gained more than
non-Māori in the latter five-year period. As a result, the gap in life
expectancy at birth between non-Māori and Māori, which widened by 2.4
years between 1985–1987 and 1995–1997, reduced by 0.6 years in the five
years to 2000–2002.
Figure H2.2 Life expectancy at birth, by
ethnic group and sex, selected years, 1950–1952 to 2000–2002

Sources: Statistics New Zealand Ministry
of Health
Note: Figures for 1981–1996 have been adjusted for undercount, using
Statistics New Zealand 's estimate of Māori life expectancy for
1996
Socio-economic differences
There is an association between life expectancy and the level
of deprivation in the area where people live. In 1998–2000, males in
the least deprived 10th of small areas in New Zealand could expect
to live 9.5 years longer than males in the most deprived 10th of small
areas. For females, the difference was smaller, but still substantial,
at 5.6 years. These figures illustrate the links between socio-economic
status and health.16
International comparison
In 2000–2002, New Zealanders' life expectancy at birth was
81.1 years for females and 76.3 years for males. This was equivalent to
the Organisation for Economic Co-operation and Development (OECD)
median of 81.1 years for females and close to the median of 75.5 years
for males for the period 2002/2003. New Zealand was ranked 15th
equal out of 30 countries for females, and 10th for males. New
Zealand 's ranking was higher than this in 1960 (sixth for males,
seventh for females). Over the 1970s and 1980s, longevity improved
faster in other OECD countries than in New Zealand . In the 1990s,
faster-than-average gains in life expectancy in New
Zealand improved its relative position. In 2002/2003, life
expectancy at birth was highest for females in Japan (85.3 years) and
highest for males in Iceland (79 years). For females, life expectancy
was slightly higher in Australia (82.8) and Canada (82.1) than in New
Zealand, similar in the United Kingdom (80.7 years) and slightly lower
in the United States (79.9 years). The pattern was similar for males:
Australia (77.8 years), Canada (77.2 years), the United Kingdom (76.2
years) and the United States (74.5 years).17
|


