Health
Obesity
Definition
The proportion of the adult population aged 15 years and over who were obese.
The proportion of children aged 2–14 years who were obese.
RelevanceTop
Obesity is associated with a long list of adult health conditions, including heart disease, high blood pressure and stroke, type 2 diabetes, various types of cancer, and psychological and social problems. Obese children are likely to be obese into adulthood.
Current level and trendsTop
In 2013/2014, the age-standardised proportion of obesity for adults was 28.7 percent, as measured by the New Zealand Health Survey. This is similar to 2012/2013 (29.6 percent) and 2011/2012 (27.9 percent), but significantly higher than 2006/2007 (25.7 percent). A total of 1,069,000 adults were estimated to be obese, a decrease of 21,000 from 2012/2013.
In 2013/2014, the age-standardised proportion of obesity for children aged 2–14 years was 10.1 percent, as measured by the New Zealand Health Survey. This is similar to 2012/2013 and 2011/2012 (10.5 percent), but slightly higher than 2006/2007 (8.4 percent). A total of 79,000 children aged 2–14 years was estimated to be obese, a similar number to 2012/2013.
Age and sex differencesTop
In 2013/2014, similar proportions of male and female adults were obese (29.1 percent of females and 28.3 of males). Between 2006/2007 and 2013/2014, there was a 3.3 percentage point increase in obesity rates for males and a 2.8 percentage point increase for females.
In 2013/2014, 9.5 percent of male children and 10.8 percent of female children were obese, while in 2006/2007 the proportions were lower: 8.0 percent and 8.8 percent for male and female children aged 2–14 years respectively.
Figure H6.1 – Proportion of population aged 2 years and over who were obese,
by sex and adult/child, 2006/2007–2013/2014
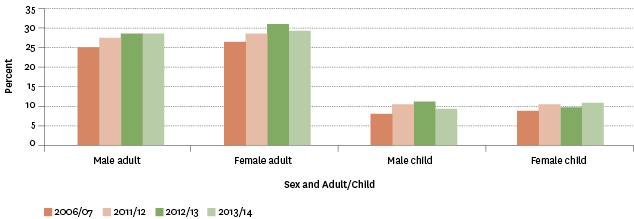
Source: Ministry of Health, New Zealand Health Survey
Note: Data has been age-standardised to the WHO World Standard population.
In 2013/2014, the proportion of the population who were obese increased with age, peaking in the 45–74 year age groups (between 34.9 percent and 36.1 percent). For those aged 75 years and over, the proportion who were obese was lower (28.6 percent). This pattern was consistent for all the surveys from 2006/2007 to 2013/2014.
In 2013/2014, for many of the age groups, the obesity rates were higher than in 2006/2007. Those aged 75 years and over had the biggest increase (8.0 percentage point increase between 2006/2007 and 2013/2014).
Table H6.1 – Proportion of population aged 2 years and over who were obese,
by age group and sex, 2006/2007–2013/2014
| 2–4 | 5–9 | 10–14 | 15–24 | 25–34 | 35–44 | 45–54 | 55–64 | 65–74 | 75+ | |
|---|---|---|---|---|---|---|---|---|---|---|
| 2006/07 | ||||||||||
| Male | 7.6 | 8.5 | 7.8 | 13.0 | 22.2 | 30.0 | 31.2 | 36.1 | 30.1 | 21.2 |
| Female | 9.0 | 8.1 | 9.4 | 15.9 | 26.6 | 27.1 | 30.4 | 36.1 | 35.9 | 20.2 |
| Total | 8.3 | 8.3 | 8.5 | 14.5 | 24.4 | 28.5 | 30.8 | 36.1 | 33.1 | 20.6 |
| 2011/12 | ||||||||||
| Male | 10.2 | 10.7 | 10.5 | 18.0 | 24.3 | 33.6 | 31.4 | 34.1 | 34.5 | 22.7 |
| Female | 9.0 | 10.5 | 11.5 | 21.0 | 27.7 | 30.7 | 31.0 | 32.0 | 39.2 | 23.4 |
| Total | 9.6 | 10.6 | 11.0 | 19.5 | 26.0 | 32.1 | 31.2 | 33.0 | 36.9 | 23.1 |
| 2012/13 | ||||||||||
| Male | 13.5 | 9.5 | 11.3 | 18.6 | 23.6 | 33.3 | 36.0 | 34.0 | 38.2 | 25.4 |
| Female | 7.3 | 11.9 | 9.2 | 21.9 | 30.0 | 33.1 | 35.1 | 37.9 | 37.1 | 27.4 |
| Total | 10.5 | 10.7 | 10.3 | 20.2 | 26.8 | 33.2 | 35.5 | 36.0 | 37.7 | 26.5 |
| 2013/14 | ||||||||||
| Male | 6.7 | 10.6 | 10.1 | 16.6 | 23.8 | 32.0 | 39.2 | 36.7 | 34.0 | 26.5 |
| Female | 9.5 | 9.6 | 12.9 | 17.7 | 29.2 | 33.2 | 32.7 | 35.5 | 35.5 | 30.8 |
| Total | 8.0 | 10.1 | 11.5 | 17.1 | 26.6 | 32.6 | 35.8 | 36.1 | 34.9 | 28.6 |
Source: Ministry of Health, New Zealand Health Survey
Note: Data has been age-standardised to the WHO World Standard population.
Ethnic differencesTop
There were large differences in the prevalence of obesity across ethnic groups. In 2013/2014, 68.4 percent of Pacific adults and 46.5 percent of adult Māori were obese, compared with 25.7 percent of European/Other adults and 14.5 percent of adults in the Asian ethnic group. This pattern of differences is also evident for previous surveys.
Similarly, 26.2 percent of Pacific children and 15.7 percent of Māori children were obese, compared with 6.7 percent of European/Other children and 6.4 percent of children in the Asian ethnic group.
Compared with 2006/2007, obesity rates for adults and children in 2013/2014 were higher for all ethnic groups (ranging from a 0.5 to a 3.8 percentage point increase).
Figure H6.2 – Proportion of population aged 15 years and over who were obese,
by ethnic group, 2006/2007–2013/2014
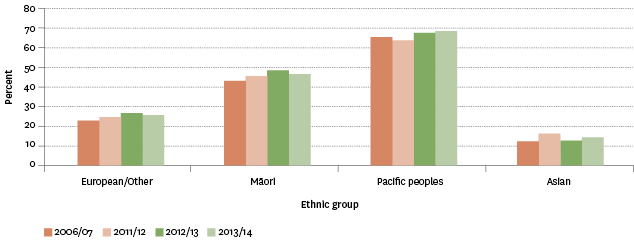
Source: Ministry of Health, New Zealand Health Survey
Note: Data has been age-standardised to the WHO World Standard population.
Socio-economic differencesTop
In 2013/2014, a greater proportion of adults living in the most deprived areas were obese compared with the least deprived areas (ie 44.5 percent of those living in NZDep2013 quintile level 5 compared with 18.4 percent of those living in NZDep2013 quintile level 1 and 22.1 percent in NZDep2013 quintile level 2). The proportions of adults living in NZDep2013 quintile levels 3 and 4 areas were 27.9 percent and 30.8 percent respectively.
The same pattern was observed for children. Nearly 1 in 5 (18.7 percent) of those living in NZDep2013 quintile level 5 was obese, compared with 4.2 percent of those living in NZDep2013 quintile level 1 and 5.2 percent living in quintile level 2. For children living in NZDep2013 quintile levels 3 and 4 areas, the proportions were 6.8 percent and 13.1 percent respectively.
Regional differencesTop
In 2013/2014, Waikato (34.4 percent), Gisborne/Hawke's Bay (33.6 percent) and Northland (33.3 percent) had the highest proportions of adults with obesity.
Auckland, Wellington, Canterbury and Tasman/Nelson/Marlborough/West Coast had the lowest rates (all around 27 percent).
International comparisonTop
A comparison of measured adult obesity rates among 13 OECD countries for 2011 or the latest available year showed that New Zealand's reported rate of 28.4 percent was above the OECD median of 24.8 percent.
The United States had the highest obesity rate (36.5 percent), followed by Mexico (32.4 percent). Australia (28.3 percent) had a similar rate to New Zealand, while the United Kingdom's rate was lower (24.8 percent).
Data for this section can be found at: www.socialreport.msd.govt.nz/documents/2016/h6.xlsx
