Health
Self-rated health
Definition
The proportion of the population aged 15 years and over who rated their health as “good”, “very good” or “excellent”.
RelevanceTop
Self-rated health is a widely used indicator of health status. It measures a person's perception of his or her overall health, and has been shown to have a strong relationship with objective measures of health status.
Current level and trendsTop
In 2013/2014, the age-standardised proportion of people stating that their health was good, very good or excellent was 92.0 percent, as measured by the New Zealand Health Survey. This is higher than previous years (90.1 percent in 2012/2013, 89.9 percent in 2011/2012 and 90.2 percent in 2006/2007).
An estimated 3,268,000 New Zealanders aged 15 years and over rated their health as good, very good or excellent in 2013/2014, an increase of 73,000 from 2012/2013.
Age and sex differencesTop
There were no differences between males and females in terms of their self-rated health, with 92.0 percent of females and 91.9 percent of males in 2013/2014 rating their health as good, very good or excellent. This pattern is reflected across time.
Figure H4.1 – Proportion of population aged 15 years and over who rated their health
as good, very good or excellent, by sex, 2006/2007–2013/2014
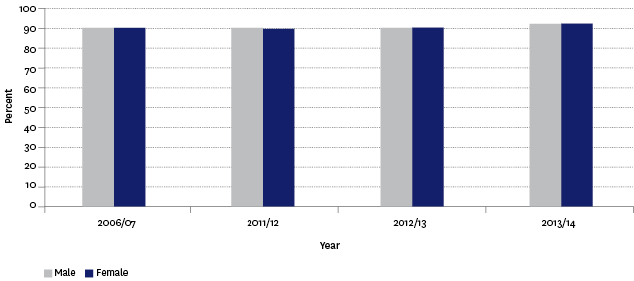
Source: Ministry of Health, New Zealand Health Survey
Note: Data has been age-standardised to the WHO World Standard population.
In 2013/2014, those in the younger age groups were more likely to state their health was good, very good or excellent (93.7 percent for those aged 15–34 years) compared with older age groups. However, a high proportion of older people still rated their health as good, very good or excellent (87.4 percent of those aged 75 years and over).
The proportion of those aged 75 years and over who stated their health was good, very good or excellent increased 7.0 percentage points from 2006/2007 to 2013/2014. Other age groups showed more modest improvements or little change.
Table H4.1 – Proportion of population aged 15 years and over who rated their
health as good, very good or excellent, by age group and sex, 2006/2007–2013/2014
| 15–24 | 25–34 | 35–44 | 45–54 | 55–64 | 65–74 | 75+ | |
|---|---|---|---|---|---|---|---|
| 2006/07 | |||||||
| Male | 93.2 | 92.1 | 89.6 | 88.6 | 89.2 | 85.3 | 79.6 |
| Female | 91.0 | 91.8 | 91.5 | 91.3 | 89.1 | 85.6 | 80.7 |
| Total | 92.1 | 92.0 | 90.6 | 90.0 | 89.1 | 85.3 | 80.4 |
| 2011/12 | |||||||
| Male | 94.0 | 90.1 | 90.1 | 89.6 | 87.7 | 86.1 | 84.5 |
| Female | 92.4 | 90.8 | 89.8 | 90.7 | 87.0 | 85.5 | 80.6 |
| Total | 93.2 | 90.4 | 89.9 | 90.2 | 87.3 | 85.8 | 82.2 |
| 2012/13 | |||||||
| Male | 92.6 | 90.7 | 90.8 | 89.7 | 87.1 | 88.7 | 80.7 |
| Female | 92.1 | 90.6 | 89.9 | 90.1 | 86.9 | 89.0 | 88.3 |
| Total | 92.3 | 90.6 | 90.3 | 89.9 | 87.0 | 88.8 | 85.0 |
| 2013/14 | |||||||
| Male | 94.2 | 94.5 | 91.8 | 88.6 | 91.8 | 88.1 | 86.7 |
| Female | 93.2 | 93.0 | 93.7 | 89.6 | 91.1 | 90.0 | 88.0 |
| Total | 93.7 | 93.7 | 92.8 | 89.1 | 91.4 | 89.2 | 87.4 |
Source: Ministry of Health, New Zealand Health Survey
Note: Data has been age-standardised to the WHO World Standard population.
Ethnic differencesTop
There was some variation in the proportion of different ethnic groups who reported their health as good, very good or excellent. In 2013/2014, 92.8 percent of people in the Asian ethnic group and 92.5 percent of European/Other, compared with 87.0 percent of Māori and 87.6 percent of Pacific peoples, rated their health as good, very good or excellent. Similar differences were found in previous surveys.
Figure H4.2 – Proportion of population aged 15 years and over who rated their health
as good, very good or excellent, by ethnic group, 2006/2007–2013/2014
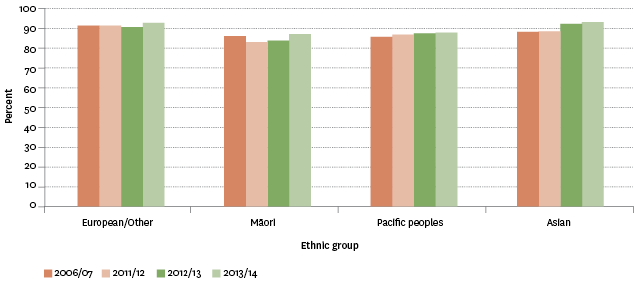
Source: Ministry of Health, New Zealand Health Survey
Note: Data has been age-standardised to the WHO World Standard population.
Socio-economic differencesTop
In 2013/2014, a higher proportion (96.0 percent) of those living in the least deprived areas (NZDep2013 quintile level 1) stated their health was good, very good or excellent compared with 87.4 percent of those living in the most deprived areas (NZDep2013 quintile level 5).
The proportions for NZDep2013 quintile levels 2, 3 and 4 were 93.6 percent, 91.7 percent and 90.7 percent respectively.
Regional differencesTop
In 2013/2014, Canterbury (92.3 percent), Tasman/Nelson/Marlborough/West Coast (91.9 percent) and Auckland (91.7 percent) had the highest proportion of their population rating their health as good, very good or excellent.
Those living in Gisborne/Hawke’s Bay (87.5 percent) and Northland (87.9 percent) had the lowest self-ratings of good health.
International comparisonTop
Comparisons with OECD countries showed that, in 2013 or the latest available year, New Zealand ranked first in terms of the percentage of the population rating their health as good or better (with 90 percent).
The next ranked countries were Canada (89 percent), the United States (88 percent) and Australia (85 percent). The OECD median was 71 percent of the population rating their health as good or better, with Japan (30 percent) and Korea (35 percent) having the lowest ratings.
Data for this section can be found at: www.socialreport.msd.govt.nz/documents/2016/h4.xlsx
