Civil and political rights
Representation of women in government
Definition
The proportion of elected Members of Parliament (MPs) who were women.
The proportion of women elected to local authorities.
RelevanceTop
The representation of women in government can be seen as an indicator of political representation more generally. Representative political institutions engage a wide range of communities in the political process, draw on the talents and skills of the broadest group of people, and provide checks and balances on the use of political power.
1. General electionsTop
Current level and trendsTop
As a result of the 2014 General Election, women held 38 of the 121 seats in Parliament, or 31 percent. This was similar to 2011 (32 percent), but below the record 41 women MPs (34 percent) elected in 2008. Under the First Past the Post (FPP) electoral system, women’s representation in Parliament increased from 13 percent in 1984 to 21 percent in 1993, and then rose sharply to 29 percent in the first Mixed Member Proportional (MMP) election held in 1996. Since then, representation of women in Parliament has been relatively stable. Women were first represented in the New Zealand Parliament in 1933.
In the 2014 General Election, women made up a similar proportion of list MPs (32 percent) and electorate MPs (31 percent). In most previous elections, however, women have been more likely to be list MPs than electorate MPs.
Figure CP2.1 – Women as a proportion of elected Members of Parliament, 1984–2014
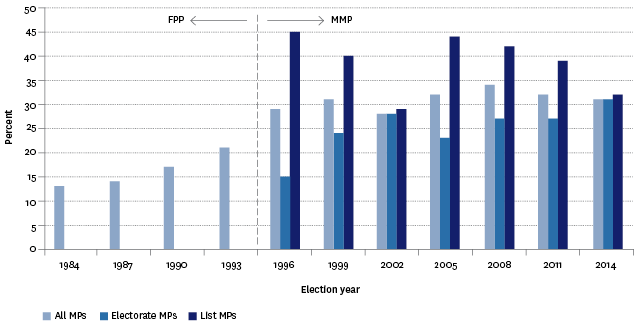
Sources: Electoral Commission; Parliamentary Library
International comparisonTop
With 31 percent of women in Parliament in 2014, New Zealand was above the OECD median of 28 percent for recent elections and ranks 12th out of 34 OECD countries. Sweden has the highest proportion of women MPs with 44 percent (in 2014), followed by Finland (42 percent in 2015), Iceland and Spain (each 41 percent in 2013 and 2011 respectively) and Norway (40 percent in 2013). New Zealand has considerably higher female representation in national government than Australia (27 percent in 2013), Canada (25 percent in 2011), the United Kingdom (23 percent in 2010) and the United States (19 percent in 2014).
2. Local authority electionsTop
Current level and trendsTop
Figure CP2.2 – Proportion of women candidates and elected women in local
government elections, 1989–2013
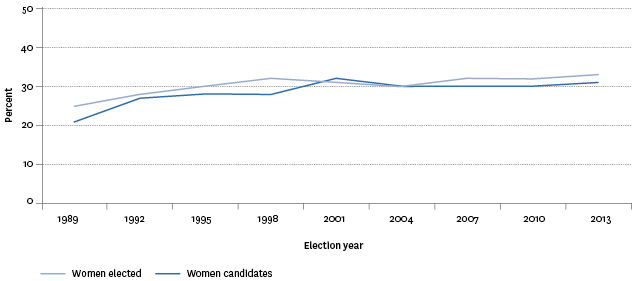
Source: Department of Internal Affairs
In 2013, women’s representation was highest on district health boards (47 percent), followed by community boards (37 percent). Between 2010 and 2013, the share of women members increased or remained stable for district health boards, district councils and community boards.
Table CP2.1 – Proportion of members who were women, by type of local
authority, 1989–2013
| 1989 | 1992 | 1995 | 1998 | 2001 | 2004 | 2007 | 2010 | 2013 | |
|---|---|---|---|---|---|---|---|---|---|
| Regional councils | 22 | 25 | 29 | 28 | 26 | 25 | 27 | 24 | 21 |
| District health boards | .. | .. | .. | .. | 44 | 42 | 46 | 46 | 47 |
| City councils | 35 | 35 | 33 | 36 | 39 | 34 | 37 | 35 | 33 |
| District councils | 19 | 23 | 26 | 27 | 26 | 26 | 28 | 28 | 30 |
| Community boards | 29 | 32 | 33 | 35 | 31 | 32 | 33 | 33 | 37 |
Source: Department of Internal Affairs
Notes: District health boards were established in 2001. Trusts are not included because they are not local authorities.
While relatively few women stood as candidates for city mayoralties in 2013 (15 percent of all candidates), nearly one–third (31 percent) of city mayors were women. The proportion of women elected to city mayoral positions remained fairly steady between 1989 and 2004 at 25–29 percent, with the exception of 1995 (20 percent). The proportion of city mayors who were women fell to 19 percent in 2007, before rising over the next two elections. The number of women mayors in district councils increased rapidly from 10 percent in 1989 to 25 percent in 1998, fell sharply to 14 percent in 2001, and remained at 17 or 18 percent over the next four elections.
Table CP2.2 – Proportion of mayors who were women, 1989–2013
| 1989 | 1992 | 1995 | 1998 | 2001 | 2004 | 2007 | 2010 | 2013 | |
|---|---|---|---|---|---|---|---|---|---|
| City mayors | 29 | 27 | 20 | 27 | 27 | 25 | 19 | 23 | 31⁷ |
| District mayors¹ | 10² | 15³ | 20 | 25 | 14⁴ | 17⁵ | 18⁶ | 17 | 17⁷ |
Source: Department of Internal Affairs
Notes: (1) Includes Chatham Islands Council. (2) Chatham Islands Council did not elect a mayor in 1989. (3) Invercargill has been a city council since 1992. (4) There was no election in Rodney District in 2001. (5) Tauranga became a city council in 2004. (6) Banks Peninsula District was abolished and included in Christchurch City in 2006. (7) Includes Auckland.
Data for this section can be found at: www.socialreport.msd.govt.nz/documents/2016/cp2.xlsx
