Social wellbeing at a glance
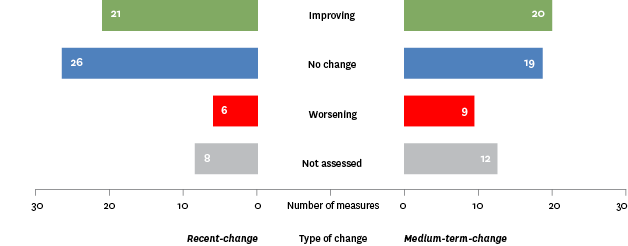
Over time, most social wellbeing outcomes for New Zealanders have improved or remained unchanged
- Outcomes have particularly improved for the Knowledge and Skills and Safety domains.
- The Health, Paid Work, Civil and Political Rights, and Leisure and Recreation domains showed a mixed picture, with some areas showing improvements and others showing no change or a worsening situation.
- Other domains, such as Economic Standard of Living and Social Connectedness, generally show a steady, unchanging picture.
- Outcomes have generally worsened for the Cultural Identity domain, though this is based on a small number of indicators.
Figure SW1.1 – Changes in measures
Social wellbeing outcomes are not the same for all New ZealandersTop
- Māori and Pacific peoples are performing less well across a number of measures, although improvements are occurring over time.
- Females continue to fall behind males in some domains such as Economic Standard of Living, while they are ahead of males in others such as Health.
- Sole-parent households consistently have poorer outcomes, particularly in the areas of Economic Standard of Living and Social Connectedness.
- Having a low income and low material wellbeing and living in an area of high deprivation result in relatively poor social wellbeing outcomes across most domains.
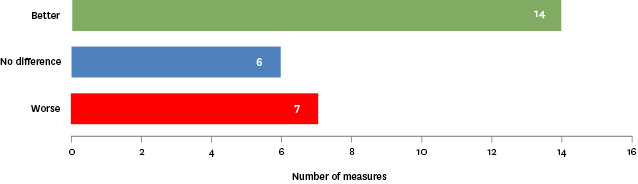
New Zealand is performing well against Organisation for Economic Co-operation and Development (OECD) countriesTop
- New Zealand is performing better than the OECD median for comparable measures in the Civil and Political Rights and Social Connectedness domains.
- New Zealand is generally performing worse than the OECD median for comparable measures in the Safety domain.
- There is a mixed picture for the remainder of the domains, with some measures showing New Zealand is performing better than the OECD, some showing a worse picture and some showing there is no difference between New Zealand and the OECD median.
Figure SW1.2 – New Zealand relative to OECD countries
Data for this section can be found at: www.socialreport.msd.govt.nz/documents/2016/sw.xlsx
