Leisure and recreation
Participation in arts and cultural activities
Definition
The proportion of the population aged 15 years and over who had attended at least one arts event in the previous 12 months.
The proportion of the population aged 15 years and over who had actively participated in the arts in the previous 12 months.
RelevanceTop
Arts and cultural activities are an integral part of leisure and recreation. People attend arts events or actively participate in the arts for a wide variety of reasons: for enjoyment and entertainment, as a means of creative expression, for personal growth and the pursuit of excellence, to learn new skills, to meet new people, and to celebrate cultural traditions. Participation in arts and cultural activities can also help people balance the stress of work and life, build capital and community identity, and contribute to social wellbeing.
Current level and trendsTop
Attendance
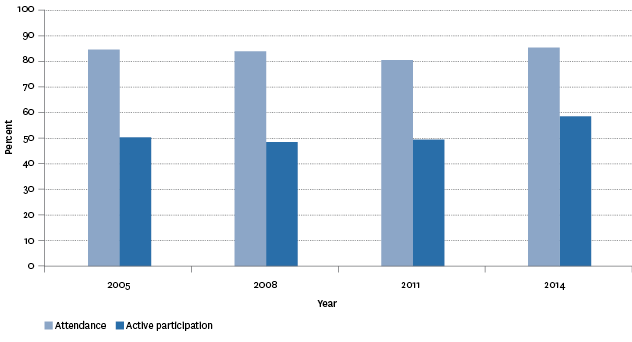
In 2014, as measured by the New Zealanders and the Arts Survey, 85 percent of the population aged 15 years and over had attended at least one arts event, with 37 percent attending more than 10 events in the previous 12 months.
The most common arts and cultural activities attended were performing arts (ie theatre, dance and music, ballet or contemporary dance performances, live theatre, concerts, musical performances or circuses), with 65 percent of the population attending at least one event in the past 12 months.
Active participation
In 2014, six in ten people (58 percent) had actively participated in the arts in the previous 12 months, with 34 percent having participated more than 12 times in the previous 12 months.
Visual arts (31 percent) was the most common activity people participated in, along with craft and object arts (ie ceramics, furniture, glass, jewellery, embroidery, quilting, pottery, woodcraft, spinning and weaving, and textiles) (27 percent).
One in five (20 percent) actively participated in performing arts, 15 percent participated in Ngā toi Māori, and 9 percent participated in Pacific arts.
The 2014 results for attendance and active participation were higher than 2011 (with attendance up 5 percentage points and active participation up 9 percentage points).
Figure L2.1 – Proportion of population aged 15 years and over who had attended
at least one arts event or actively participated in the arts in the previous
12 months, 2005–2014

Source: Creative New Zealand
Age and sex differencesTop
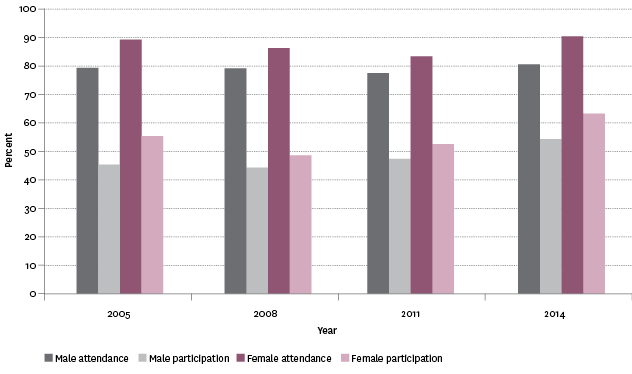
Females were more likely than males to attend and actively participate in arts events. This pattern was found across the four survey periods. Attendance at arts events for both sexes remained relatively stable from 2005 to 2011, but rose for females between 2011 and 2014 (from 83 percent to 90 percent). Active participation in the arts for both sexes has been rising since 2008.
Figure L2.2 – Proportion of population aged 15 years and over who had attended
at least one arts event or actively participated in the arts in the previous 12 months,
by sex, 2005–2014

Source: Creative New Zealand
In general, attendance and active participation in art events in the previous 12 months decreased as age increased. In 2014, 90 percent of those aged 30–39 years attended at least one arts event, compared with 80 percent of those aged 70 years and over.
A larger age difference was found for active participation in the arts, with 71 percent of those aged 15–29 years old participating, compared with 48 percent of those aged 70 years and over. Similar results were found over the other survey periods.
Table L2.1 – Proportion of population aged 15 years and over who had attended
at least one arts event or actively participated in the arts in the previous
12 months, by age group, 2005–2014
| 15–29 | 30–39 | 40–49 | 50–59 | 60–69 | 70+ | |
|---|---|---|---|---|---|---|
| 2005 | ||||||
| Attendance | 85 | 90 | 83 | 83 | 79 | 79 |
| Participation | 64 | 49 | 47 | 48 | 42 | 35 |
| 2008 | ||||||
| Attendance | 84 | 84 | 88 | 81 | 78 | 74 |
| Participation | 61 | 51 | 45 | 45 | 39 | 35 |
| 2011 | ||||||
| Attendance | 85 | 84 | 75 | 78 | 77 | 77 |
| Participation | 66 | 52 | 38 | 45 | 44 | 38 |
| 2014 | ||||||
| Attendance | 86 | 90 | 82 | 88 | 84 | 80 |
| Participation | 71 | 60 | 54 | 55 | 53 | 48 |
Source: Creative New Zealand
Ethnic differencesTop
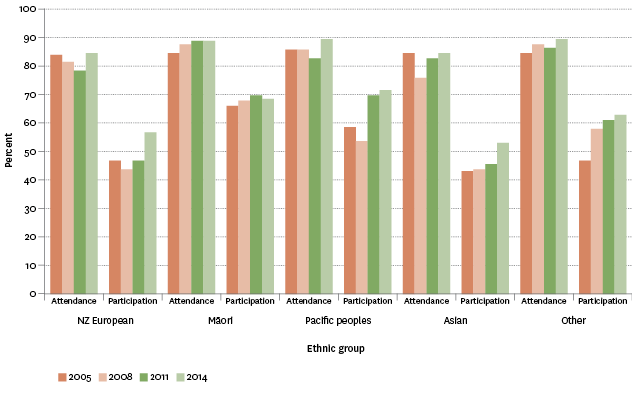
In 2014, 90 percent of Pacific peoples and 89 percent of Māori attended at least one arts event in the previous 12 months, compared with 85 percent of people in the Asian ethnic group and New Zealand Europeans.
Similarly, 72 percent of Pacific peoples and 69 percent of Māori actively participated in at least one arts event, compared with 57 percent of New Zealand Europeans and 53 percent of people in the Asian ethnic group.
Figure L2.3 – Proportion of population aged 15 years and over who had attended
at least one arts event or actively participated in the arts in the previous 12 months,
by ethnic group, 2005–2014

Source: Creative New Zealand
Socio-economic differencesTop
In 2014, 81 percent of those with a household income up to $30,000 attended at least one arts event in the previous 12 months, compared with 90 percent of those with a household income of $120,000 or more.
However, a similar proportion of people in both income groups actively participated in at least one arts event (57 percent of those with a household income up to $30,000, compared with 58 percent of those with a household income of $120,000 or more).
International comparisonTop
Research undertaken by the European Union in 2013 found that active involvement in artistic activities varied among European Union countries. Northern European countries were most likely to be actively involved in an artistic activity (eg Denmark at 74 percent and Sweden at 68 percent). Those from eastern and southern European countries were less likely to have personally engaged in an artistic activity (Bulgaria at 14 percent and Italy at 20 percent).
Data for this section can be found at: www.socialreport.msd.govt.nz/documents/2016/l2.xlsx

