Safety
Road casualties
Definition
The number of people killed in motor vehicle traffic crashes as a proportion (per 100,000) of the total population.
The number of people injured in motor vehicle traffic crashes as a proportion (per 100,000) of the total population.
RelevanceTop
Motor vehicle traffic crashes are a major cause of premature death, especially among younger age groups. Deaths, injuries and disability resulting from motor vehicle traffic crashes inflict considerable pain and suffering on individuals, families and communities, as well as on other road users, emergency service providers, health workers and others.
Current levels and trendsTop
In 2014, 294 people died as a result of motor vehicle traffic crashes, a rate of 6.5 deaths per 100,000 population – this compares with a rate of 5.7 deaths per 100,000 population in 2013. Reported injury data for 2014 shows a further 11,219 people were injured, a rate of 248.8 injuries per 100,000 population. In 2004, the motor vehicle traffic crash mortality rate was 10.7 per 100,000 population and the motor vehicle traffic crash injury rate was 342.0 per 100,000 population. The mortality and injury rates in 1994 were 16.2 and 464.1 per 100,000 population respectively.
The number of people killed in motor vehicle traffic crashes in 2014 was less than half what it was in 1980. The number of people injured rose from 2000 to 2007 (partly because of better recording by police), but then decreased from 2008 to 2014. There were 50 percent fewer people injured in 2014 than in 1980. The ratio of motor vehicle traffic crash injuries to deaths has increased since 1980, from 26.5 injuries for each fatality in 1980 to 38.2 injuries per fatality in 2014.
There is no conclusive evidence on the reasons for the reduction in motor vehicle traffic crashes since the mid-1980s. Better roads and better vehicles, as well as legislation, enforcement and education aimed at reducing road casualties, may all have contributed to an improvement in drivers’ attitudes and behaviour.
Figure SS4.1 – Motor vehicle traffic crash injury and death rates per 100,000
population, 1980–2014
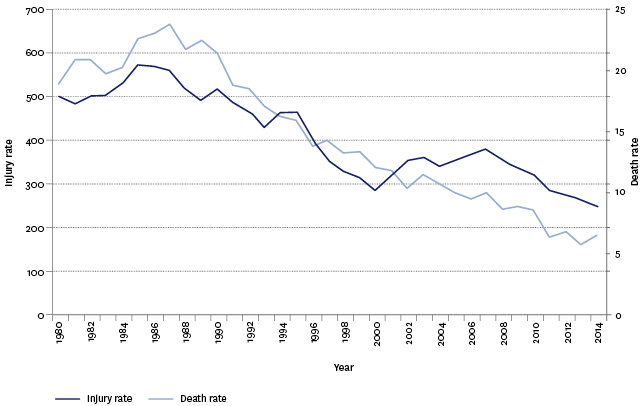
Source: Land Transport Safety Authority (LTSA) Crash Analysis System
Age and sex differencesTop
The motor vehicle traffic crash mortality rate has fallen steadily for all age groups since the 1990s. The decline has been particularly marked among 15–24 years, who had an average annual rate of 12.2 deaths per 100,000 in the period 2010–2014. This is a big improvement on the average annual rate of 39.8 deaths per 100,000 population in the 1990–1994 period, and 19.5 deaths per 100,000 population in the period 2005–2009.
Males are much more likely than females to be killed in motor vehicle traffic crashes. Between 2010 and 2014, the average annual motor vehicle traffic crash mortality rate for males was 9.8 deaths per 100,000 males, while the rate for females was 4.0 deaths per 100,000 females. For both sexes, this was less than half the average annual rate in the early 1990s (25.7 deaths per 100,000 for males and 10.8 per 100,000 for females in 1990–1994).
Figure SS4.2 – Motor vehicle traffic crash death rates per 100,000 population,
by age group, 1990–2014
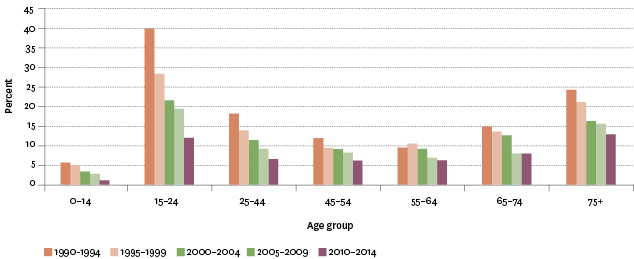
Source: LTSA Crash Analysis System
Ethnic differencesTop
Māori are more likely than non-Māori to die as a result of a motor vehicle traffic crash. In 2012, the age-standardised motor vehicle traffic crash death rate was 17.6 per 100,000 population for Māori and 5.6 per 100,000 population for non-Māori.
Figure SS4.3 – Motor vehicle traffic crash mortality age-standardised rates,
by ethnic group, 1996–2012
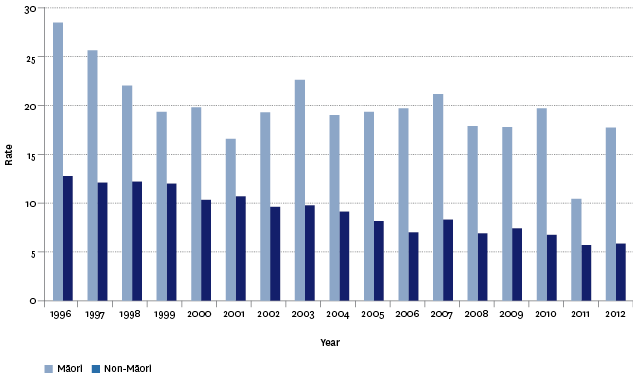
Source: Ministry of Health
International comparisonTop
In 2012, New Zealand had a motor vehicle traffic crash mortality rate of 7.3 per 100,000 population (standardised to the 2010 OECD population). This was slightly higher than the 2013 OECD mean of 7.0 deaths per 100,000 population. In 2011, however, the New Zealand rate was 6.5 deaths per 100,000 population, which was less than the OECD mean of 7.6 deaths per 100,000 population. The United Kingdom had the lowest rate of motor vehicle traffic crash mortality (2.8 per 100,000 population in 2013), while Mexico had the highest (17.4 per 100,000 population in 2012). Australia had a motor vehicle traffic crash mortality rate of 6.8 deaths per 100,000 population in 2011.
Data for this section can be found at: www.socialreport.msd.govt.nz/documents/2016/ss4.xlsx
