Health
Health expectancy
Definition
The number of years a person could expect to live in good health (ie live independently with no functional limitation that needs assistance). This is also known as Independent Life Expectancy.
RelevanceTop
Health expectancy is a summary measure of a population's health that captures both the quantity and quality of life dimensions of health. It offers a way of assessing how many years a population has gained in life expectancy are spent in good health and free from functional limitations. It is a positive measure, capturing expectations of a life free from functional limitation that require assistance. Improvements in health expectancy reflect changes in social and economic conditions, lifestyle changes, medical advances and better access to health services.
Current level and trendsTop
While health expectancy increased in absolute terms for both sexes, the proportion of years people lived independently relative to their total life expectancy was lower in 2013 compared with 1996: a 3.7 percent decrease for males and a 3.4 percent decrease for females. Therefore, while people are living longer, both in good and poor health, they are spending proportionally less of their total life in “good” health.
In 2013, males had a health expectancy of 65.2 years and females had a health expectancy of 66.5 years, as calculated by the Ministry of Health using the New Zealand Disability Survey and Statistics New Zealand Life Tables. Females had only a small increase in health expectancy between 1996 and 2013 (0.1 years), while males gained 1.4 years over the same time period. The 2013 gender gap (ie the difference between males and females) was 1.3 years – the closest it had been between 1996 and 2013.
Table H2.1 – Life expectancy and health expectancy (years), by sex, 1996 and 2013
| Life expectancy (years) | Health expectancy (years) | |
|---|---|---|
| 1996 | ||
| Male | 74.4 | 63.8 |
| Female | 79.7 | 66.4 |
| Difference | 5.3 | 2.6 |
| 2013 | ||
| Male | 79.5 | 65.2 |
| Female | 83.2 | 66.5 |
| Difference | 3.7 | 1.3 |
Source: Ministry of Health
While males have a lower life expectancy, they are more likely to spend a higher proportion of their lives in good health. For example, a male can expect to live 82.0 percent of his life independently, compared with 79.9 percent of females.
This means that females are expected to live 16.7 years with a disability for which they need support – 10.7 years of non-daily assistance and 6.0 years of daily assistance. This is 2.4 years longer than males (14.3 years – 10.2 years of non-daily assistance and 4.1 years of daily assistance). Reasons for males having higher proportions of good health include males being less likely to report functional limitations, and males being more active and more likely to engage in risky behaviour that shortens their lives compared with females.
Figure H2.1 – Health expectancy (years of life at birth free from functional limitation),
by sex, 1996–2013
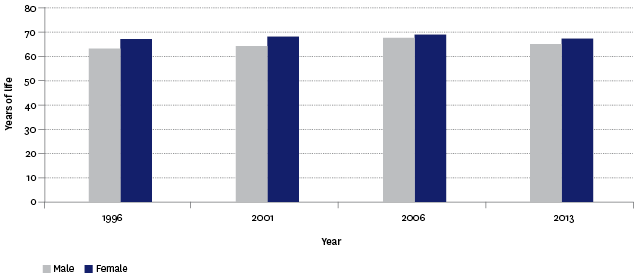
Source: Ministry of Health
Note: Caution is advised when comparing the results of the 2006 Disability Survey with that for previous and subsequent surveys owing to a range of methodological and other factors. See the technical notes for more information.
Ethnic differencesTop
Māori can expect to live fewer years independently compared with non-Māori. In 2013, Māori males had a health expectancy of 54.3 years (74.4 percent of their lives), compared with 66.7 years for non-Māori males (83.0 percent). Māori females had a health expectancy of 60.4 years (78.4 percent), compared with 67.4 years for non-Māori females (80.4 percent).
In addition to living longer independently, non-Māori males and females had fewer years with a disability requiring assistance compared with Māori. Non-Māori males are expected to live 13.6 years with some level of disability requiring assistance (9.6 years of non-daily assistance and 4.0 years of daily assistance). In comparison, Māori males were expected to live 18.7 years with a disability (14.2 years of non-daily assistance and 4.5 years of daily assistance). Non-Māori females are expected to live 16.5 years with a disability (10.4 years of non-daily assistance and 6.1 years of daily assistance), compared with 16.7 years for Māori females (12.0 years of non-daily assistance and 4.7 years of daily assistance).
Comparing 1996 with 2013, the time spent in good health has increased for Māori females, non-Māori females and non-Māori males but decreased for Māori males (1.7 years).
Figure H2.2 – Health expectancy (years of life at birth free from functional limitation),
by ethnic group and sex, 1996–2013
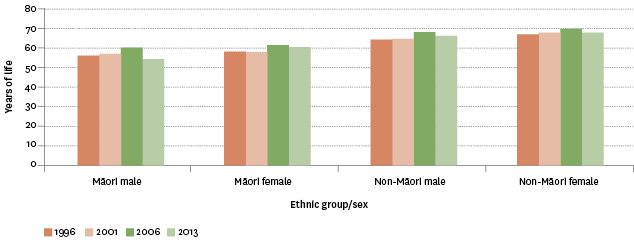
Source: Ministry of Health
Note: Caution is advised when comparing the results of the 2006 Disability Survey with that for previous and subsequent surveys owing to a range of methodological and other factors. See the technical notes for more information.
There are also differences when looking at the proportion of years people lived independently relative to their total life expectancy. For example, in 2013 compared with 1996, the proportion of years Māori males lived independently decreased by 9.7 percent; for Māori females, it decreased by 3.3 percent; for non-Māori males, it decreased by 2.5 percent; and for non-Māori females, it decreased by 2.7 percent.
Data for this section can be found at: www.socialreport.msd.govt.nz/documents/2016/h2.xlsx
