Health
Psychological distress
Definition
The proportion of the population aged 15 years and over who reported experiencing high or very high levels of psychological distress and had a high probability of having an anxiety or depressive disorder.
RelevanceTop
The probability of having an anxiety or depressive disorder is measured using the Kessler Psychological Distress Scale (K10). People who score 12 or more on the K10 have experienced high or very high levels of psychological distress in the past four weeks and have a high probability of having an anxiety or depressive disorder.
Current level and trendsTop
In 2013/2014, the age-standardised proportion of people experiencing high or very high levels of psychological distress was 6.4 percent, as measured by the New Zealand Health Survey. This is similar to 2012/2013 (6.3 percent) and 2006/2007 (6.8 percent), but higher than 2011/2012 (4.7 percent).
In 2013/2014, an estimated 221,000 New Zealanders aged 15 years and over reported experiencing high or very high levels of psychological distress, an increase of 3,000 from 2012/2013.
Age and sex differencesTop
The proportion of females who reported experiencing high or very high levels of psychological distress has been consistently higher than males. In 2013/2014, 7.5 percent of females reported experiencing high or very high levels of psychological distress, compared with 5.2 percent of males.
Figure H5.1 – Proportion of population aged 15 years and over who experienced
psychological distress, by sex, 2006/2007–2013/2014
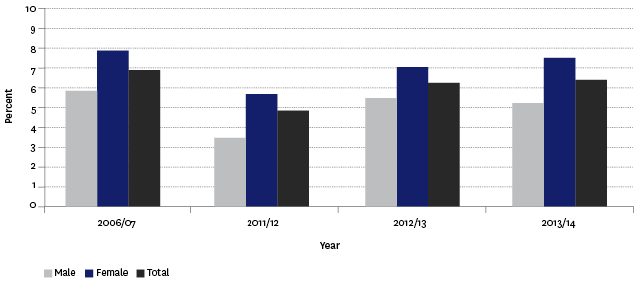
Source: Ministry of Health, New Zealand Health Survey
Note: Data has been age-standardised to the WHO World Standard population.
In general, there were small differences between age groups. In 2013/2014, those aged 15–24 years and 45–54 years (7.2 percent each) were slightly more likely to experience psychological distress compared with other age groups. Those aged 75 years and over were least likely to experience psychological distress (4.4 percent).
Over time, there has been a decrease in the proportion of those aged 75 years and over experiencing high to very high levels of psychological distress (a 3.7 percentage point decrease from 2006/2007 to 2013/2014).
Table H5.1 – Proportion of population aged 15 years and over who experienced
psychological distress, by age group and sex, 2006/2007–2013/2014
| 15–24 | 25–34 | 35–44 | 45–54 | 55–64 | 65–74 | 75+ | |
|---|---|---|---|---|---|---|---|
| 2006/07 | |||||||
| Male | 7.0 | 6.2 | 5.3 | 5.2 | 4.1 | 5.5 | 6.9 |
| Female | 12.0 | 7.4 | 7.4 | 5.0 | 5.5 | 4.8 | 9.1 |
| Total | 9.5 | 6.9 | 6.4 | 5.1 | 4.8 | 5.2 | 8.1 |
| 2011/12 | |||||||
| Male | 3.7 | 3.8 | 3.8 | 3.8 | 3.1 | 3.2 | 3.1 |
| Female | 5.8 | 6.7 | 6.0 | 5.4 | 4.6 | 4.2 | 3.9 |
| Total | 4.7 | 5.3 | 4.9 | 4.6 | 3.9 | 3.7 | 3.5 |
| 2012/13 | |||||||
| Male | 6.0 | 6.5 | 5.0 | 5.5 | 4.6 | 4.2 | 5.3 |
| Female | 7.8 | 6.5 | 7.4 | 7.9 | 7.0 | 4.9 | 4.0 |
| Total | 6.9 | 6.5 | 6.2 | 6.8 | 5.8 | 4.6 | 4.6 |
| 2013/14 | |||||||
| Male | 4.8 | 5.3 | 5.9 | 6.3 | 5.0 | 3.6 | 3.4 |
| Female | 9.6 | 7.6 | 6.7 | 8.1 | 5.3 | 6.0 | 5.2 |
| Total | 7.2 | 6.5 | 6.3 | 7.2 | 5.2 | 4.8 | 4.4 |
Source: Ministry of Health, New Zealand Health Survey
Note: Data has been age-standardised to the WHO World Standard population.
Ethnic differencesTop
There are variations in the proportion of different ethnic groups who report high or very high levels of psychological distress. In 2013/2014, 12.6 percent of Pacific peoples and 9.1 percent of Māori reported experiencing high or very high levels of psychological distress, compared with 5.9 percent of European/Other and 4.4 percent of people in the Asian ethnic group.
Figure H5.2 – Proportion of population aged 15 years and over who experienced
psychological distress, by ethnic group, 2006/2007–2013/2014
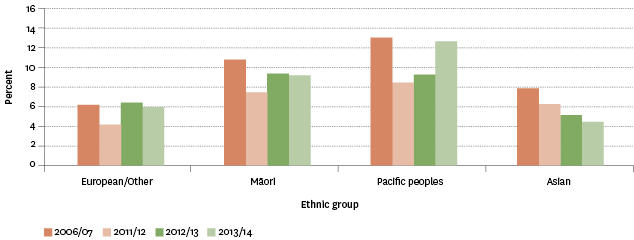
Source: Ministry of Health, New Zealand Health Survey
Note: Data has been age-standardised to the WHO World Standard population.
Socio-economic differencesTop
A smaller proportion of those living in the least deprived areas reported high or very high levels of psychological distress, compared with those living in the most deprived areas (ie 4.0 percent of those living in the NZDep2013 quintile level 1, compared with 9.3 percent of those living in NZDep2013 quintile level 5).
The proportions for NZDep2013 quintile levels 2, 3 and 4 were 5.7 percent, 6.8 percent and 6.5 percent respectively.
Regional differencesTop
In 2013/2014, Gisborne/Hawke's Bay had the highest proportion of people reporting high or very high levels of psychological distress (9.5 percent), whereas Manawatu-Wanganui and Tasman/Nelson/Marlborough/West Coast had the lowest proportions (4.4 percent each).
Data for this section can be found at: www.socialreport.msd.govt.nz/documents/2016/h5.xlsx
