Knowledge and skills
School leavers with higher qualifications
Definition
The proportion of secondary school leavers who left school with a qualification at National Certificate of Educational Achievement (NCEA) Level 2 or above.
RelevanceTop
Upper secondary school qualifications serve as the foundation for higher (post-secondary) learning and training opportunities, as well as the preparation for direct entry into the labour market. Those who leave school early with few qualifications are at a much greater risk of unemployment or vulnerability in the labour force, and of having low incomes.
Current level and trendsTop
In 2014, 77.1 percent of school leavers (46,729 students) left school with a qualification at NCEA Level 2 (L2) or above. This was an increase from 2013 (74.7 percent), and follows a pattern of increases since 2009, when the rate was 67.5 percent.
Because of changes in the qualifications framework, it is not possible to exactly compare time series data prior to 2009. Data prior to 2008 is a best fit but, again, emphasises the improvement in this measure since a low point in 2001 (37.3 percent).
Figure K2.1 – Proportion of school leavers with NCEA Level 2 or above, or equivalent,
1997–2014
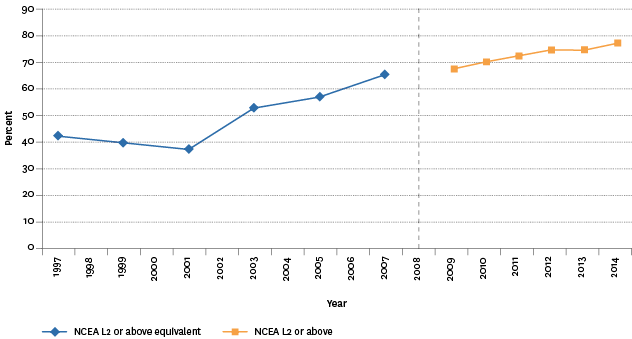
Source: MSD The Social Report 2010, Ministry of Education
Age and sex differencesTop
The age at which students leave school has a clear impact on qualification levels gained. In 2014, 93.6 percent of 18 year olds (23,409 students) and 84.9 percent of 17 year olds (19,437 students) left school with a qualification of NCEA L2 or above, compared with 26.8 percent of 16 year olds (2,310 students).
Female students were more likely than male students to leave secondary school with a qualification of NCEA L2 or above (79.9 percent and 74.5 percent respectively). The sex difference has, however, declined since 2010, from 8.9 percentage points to 5.4 percentage points.
Table K2.1 – Proportion of school leavers with NCEA Level 2 or above,
by selected age groups and sex, 2009–2014
| Year | 15 | 16 | 17 | 18 | Male | Female | Total (all leavers) |
|---|---|---|---|---|---|---|---|
| 2009 | 2.2 | 16.0 | 76.2 | 89.1 | 63.4 | 71.7 | 67.5 |
| 2010 | 2.3 | 18.9 | 77.9 | 90.6 | 65.9 | 74.8 | 70.2 |
| 2011 | 3.5 | 24.3 | 80.5 | 90.9 | 68.3 | 76.8 | 72.4 |
| 2012 | 2.7 | 21.2 | 82.9 | 93.5 | 70.9 | 78.7 | 74.7 |
| 2013 | 4.2 | 22.5 | 82.9 | 91.2 | 71.8 | 77.7 | 74.7 |
| 2014 | 3.7 | 26.8 | 84.9 | 93.6 | 74.5 | 79.9 | 77.1 |
Source: Ministry of Education
Ethnic differencesTop
The proportion of school leavers with NCEA L2 and above varies significantly between ethnic groups. In 2014, students in the Asian ethnic groups had the highest proportion at 89.7 percent, followed by Middle Eastern/Latin American/African (MELAA) students (81.2 percent), European students (81.0 percent), Pacific students (71.9 percent) and Māori students (58.6 percent).
While starting from lower rates, Pacific and Māori students have made greater gains in the proportion leaving school with NCEA L2 or above, with increases of 15.5 and 13.0 percentage points respectively between 2009 and 2014. This compares with a percentage point gain of 9.6 percentage points for the total school leaver population over the same period.
Table K2.2 – Proportion of school leavers with NCEA Level 2 or above,
by ethnic group, 2009–2014
| Year | European | Māori | Pacific peoples | Asian | MELAA | Total |
|---|---|---|---|---|---|---|
| 2009 | 72.8 | 45.6 | 56.4 | 82.8 | 69.5 | 67.5 |
| 2010 | 75.4 | 49.5 | 60.1 | 85.0 | 70.2 | 70.2 |
| 2011 | 77.6 | 52.5 | 63.7 | 85.7 | 77.5 | 72.4 |
| 2012 | 79.8 | 55.4 | 65.6 | 87.0 | 78.1 | 74.7 |
| 2013 | 79.2 | 55.8 | 68.2 | 88.1 | 77.3 | 74.7 |
| 2014 | 81.0 | 58.6 | 71.9 | 89.7 | 81.2 | 77.1 |
Source: Ministry of Education
Note: Ethnic group is total response.
Socio-economic differencesTop
The impact of socio-economic status can be clearly seen using the decile rating of the school children are attending. Deciles range from 1 to 10, with Decile 10 schools being the least disadvantaged and Decile 1 schools the most disadvantaged. Students from low-decile schools are less likely than other students to attain NCEA L2 or above. In 2014, 60.3 percent of school leavers from Decile 1 schools left with a qualification of NCEA L2 or above compared with 92.5 percent of school leavers from Decile 10 schools.
Over the period 2009–2014, the improvement in the proportion of school leavers with a qualification of NCEA L2 or above was highest for lower-decile schools, with Decile 1 schools improving by 12.5 percentage points, compared with 3.7 percentage points for Decile 10 schools.
Figure K2.2 – Proportion of school leavers with NCEA Level 2 or above,
by school decile, 2009 and 2014
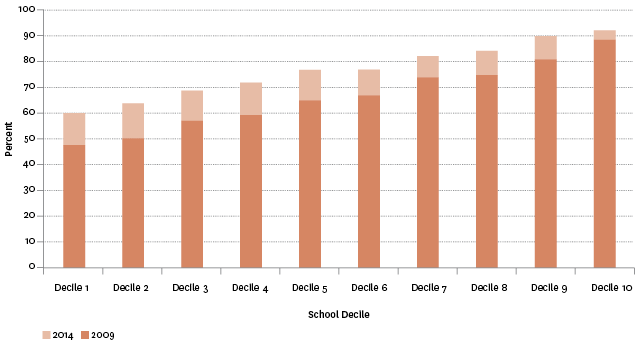
Source: Ministry of Education
Regional differencesTop
There are marked differences across regions in terms of those who leave school with NCEA L2 or above. In 2014, Wellington had the highest proportion of school leavers with NCEA L2 or above (83.3 percent), followed by Auckland (81.6 percent) and Otago (81.3 percent). This compares with Northland (69.9 percent) and Taranaki (73.9 percent). While Wellington has ranked regularly as the top performer along with Otago, there are variations across time resulting in year-on-year changes to the regional rankings.
Data for this section can be found at: www.socialreport.msd.govt.nz/documents/2016/k2.xlsx
