Economic standard of living
Population with low incomes
Definition
The proportion of the population in households with equivalised disposable income net-of-housing-costs.
RelevanceTop
Having insufficient economic resources limits people’s ability to participate in and belong to their community and wider society, and otherwise restricts their quality of life. Furthermore, long-lasting low family income in childhood is associated with negative outcomes, such as lower educational attainment and poorer health.
Three measures are provided to give a fuller picture of change over time. The primary measure is the proportion of people in households with equivalised disposable income net-of-housing-costs below a threshold set at 50 percent of the 2007 household disposable income median – and held fixed in real terms (the 2007 anchored or constant value measure, CV-07). This measure shows whether the incomes of low-income households are rising or falling in real terms, irrespective of what is happening to the incomes of the rest of the population. The two other measures use fully relative thresholds set at 50 and 60 percent of the current year's household disposable income median net-of-housing-costs (REL 50/60). These measures reflect how low-income households are faring relative to middle-income households.
Current level and trendsTop
In 2014, 13 percent of the population were living in households with equivalised disposable income net-of-housing-costs below 50 percent of the 2007 household disposable income median (CV-07). This was similar to 2013 (12 percent), and below the post Global Financial Crisis peak of 14 percent in 2011.
Looking at CV-07 longer term, the proportion in low-income households rose from 8 percent in 1982 to a high of 22 percent in 1994, then fell to 13 percent in 2007 before rising briefly during the Global Financial Crisis then settling at close to 13 percent in 2012–2014. The proportion of households with low incomes in 2014 (13 percent) remains higher than in 1982 (8 percent).
Looking at trends using a moving threshold (REL 50), the proportion of households with low incomes rose from 6 percent in 1982 to 13 percent in 1994, then remained relatively stable until 2007, when there was a further rise reaching 15 percent in 2011 and 2014, over twice as high as in 1982. The rise in 2014 for both the REL 50 and REL 60 measures mainly reflects the rise in the median, not changing incomes at the lower end.
Figure EC3.1 – Proportion of population with net-of-housing-costs household incomes
below selected thresholds, 1982–2014
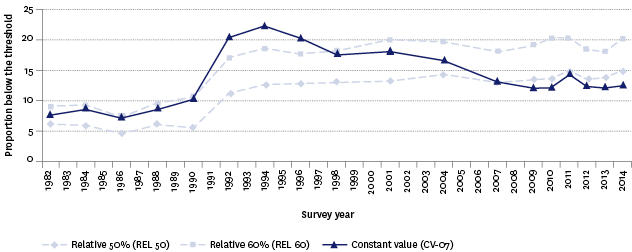
Source: Perry (2015a), Ministry of Social Development, using data from Statistics New Zealand's Household Economic Survey
Note: The period between Household Economic Surveys has varied across the period shown.
Age and sex differencesTop
There are distinct differences by age. The relatively small proportion in households with low incomes for those currently aged 65 years and over (4 percent in 2014 using CV-07) reflects the combined effect of a relatively high rate of mortgage-free home ownership and universal public provision retirement support. The proportion with low household incomes in 2014 was highest for those aged 18–24 years of age (19 percent), followed by children aged 0–17 years (17 percent).
Changes over the period of the survey show a broadly similar pattern, though improvements following peaks in 1994 were less pronounced for those aged 18–24 and 45–64 years. Proportionately, those aged 0–17 and 25–44 years saw declines between 1994 and 2014 of 17 and 11 percentage points respectively, in contrast to those aged 18–24 and 45–64 years, who saw much lower declines, of 1 and 4 percentage points respectively.
Figure EC3.2 – Proportion of population with net-of-housing-costs household incomes
below threshold using CV-07, by age group, selected years 1986–2014
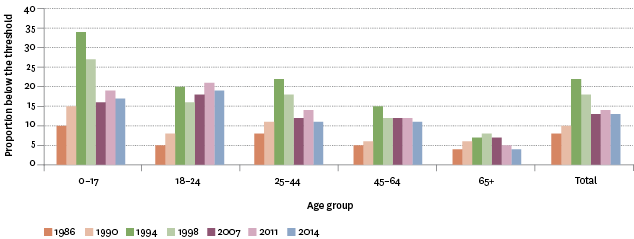
Source: Perry (2015a), Ministry of Social Development, using data from Statistics New Zealand's Household Economic Survey
In terms of sex differences, over the period of the survey, the proportion on low incomes using CV-07 has been consistently a little higher for females than males. In 2014, for those aged 15 years and over, the proportion of females in low-income households was 12 percent, compared with 10 percent for males.
Ethnic differencesTop
Sample sizes in the source data are not large enough to support reliable low-income time series for the population by ethnicity using CV-07. Trends in equivalised median household incomes are less volatile and are used to give relativities between ethnic groups.
For all ethnic groups, median household incomes rose steadily from the low point in 1994 through to 2007. There has been a small net increase from 2007 to 2014 for Māori and Other, and a small net decline for Pacific peoples. Over the period of the survey, equivalised median household incomes for the European group have ranked the highest of all ethnic groups, followed, on average, by the Other ethnic group, Māori and Pacific peoples.
Figure EC3.3 – Real equivalised median household incomes, by ethnic group,
1988–2014 ($2014)
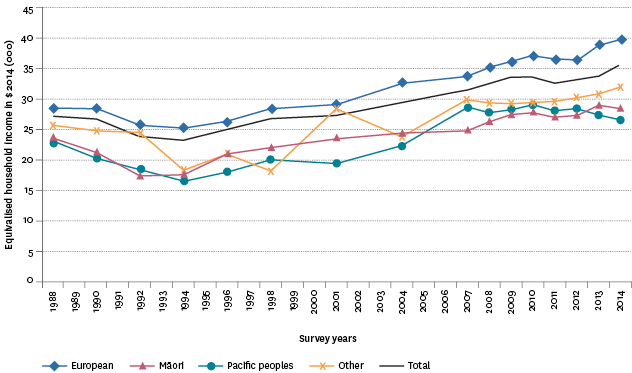
Source: Perry (2015a), Ministry of Social Development, using data from Statistics New Zealand's Household Economic Survey
Note: Ethnicity used for this figure is prioritised not total response (each person is captured in one ethnic group only).
Household and family type differencesTop
Sole-parent households had the highest proportion in low-income households using CV-07 (51 percent in 2014), followed by single-person households aged under 65 years (22 percent in 2014). Households with a single person or couples aged 65 years of age and older had the lowest proportion on low incomes (4 percent in 2014).
For families with dependent children, 58 percent of sole-parent families living on their own had low incomes using CV-07. This compares with sole-parent families living with others, where the proportion was lower at 20 percent in 2014, reflecting shared household resources. The proportion of two-parent families with dependent children on low household incomes was 9 percent in 2014.
International comparisonTop
Data for this section can be found at: www.socialreport.msd.govt.nz/documents/2016/ec3.xlsx
